| Issue |
Dairy Sci. Technol.
Volume 90, Number 2-3, March–June 2010
Special Issue: Selected papers from 4th International Symposium on Spray Dried Dairy Products, 15-17th April 2009, Melbourne, Australia |
|
|---|---|---|
| Page(s) | 225 - 236 | |
| DOI | https://doi.org/10.1051/dst/2009043 | |
| Published online | 10 November 2009 | |
Original article
The influence of stirring speed, temperature and solid concentration on the rehydration time of micellar casein powder
搅拌速度温度和固形物浓度对酪蛋白粉再水化作用的影响
Influence de la vitesse d’agitation, de la température et de la concentration sur le temps de réhydratation de la caséine micellaire
1
INRA, UMR1253, F-35042 Rennes, France
2
AGROCAMPUS OUEST, UMR1253, F-35042 Rennes, France
3
INRA, UPR638, F-59651 Villeneuve d’Ascq, France
4
Laboratoire de Génie des procédés, HEI, F-59046 Lille, France
* Corresponding author (通讯作者): This email address is being protected from spambots. You need JavaScript enabled to view it.
Received:
30
March
2009
Revised:
24
July
2009
Accepted:
22
September
2009
Abstract
Rehydration is an essential quality attribute of dairy powders. Before industrial use, most powders are generally dissolved in mechanically stirred tanks in order to obtain a homogeneous solution as quickly as possible. The purpose of the present study was to investigate the effect of stirring conditions on the rehydration properties of a micellar casein powder. The powder particle size distribution was initially monitored during rehydration process under various conditions: hydrodynamic (400–1000 rpm), temperature (26–30 °C) and solid concentration (4.8–12% [w/w]) conditions. Then, the time required to achieve a predetermined rehydration value was determined. Finally, rehydration times were correlated to hydrodynamic conditions using a process relationship obtained from experimental data and dimensional analysis. The results showed that increasing temperature and/or agitation resulted in decreasing the rehydration time and analysis of the data enabled their respective influences to be compared. For example, increasing the temperature by only 4 °C has the same influence on rehydration time as doubling the stirring speed. Therefore, it could be concluded that temperature has a major effect on rehydration behaviour. The process relationship suggested that for the mixing system investigated, under isothermal conditions and for the range of flow conditions and suspensions studied, the number of revolutions required to achieve a desired degree of rehydration is independent of the impeller rotational speed. However, increasing the solid concentration from 4.8% to 12% significantly increased the number of revolutions required. These results are consistent with the hydrodynamic theory that higher stirring speeds are required at higher solid concentrations in freshly suspended powders.
摘要
再水化能力是乳粉最基本的质量特性。过去,在工业生产中为了获得均匀的溶液通常采用机械搅拌的方法将乳粉快速溶解。本文目的是研究搅拌条件对酪蛋白胶束粉再水化性质的影响。在流体力(400~1000 rpm)、温度(26~30 °C)和固形物浓度(4.8~12%,w/w)变化的条件下,最初检测了再水化过程中粉末粒度的分布;其次,测定了达到预定水化值所需要的时间;最后,根据测定的实验数据和因次分析确定了再水化时间与流体动力学条件之间的相关性。基于数据分析和试验结果的比较,温度和搅拌速度的提高使得再水化时间降低。例如,温度仅增加4 °C与搅拌速度加倍对再水化作用产生的影响相同。因此,温度是影响再水化作用的主要因素。这种过程的相关性表明,对于在等温条件下的混合体系和流动条件的范围及所研究的悬浊液而言,达到理想的再水化程度达到所需要的转数与叶轮的转数无关。然而,固形物浓度从4.8%增加到12%,搅拌转数显著地增加。这些实验结果与高固形物浓度需要高转速的流体动力学理论相一致。
Résumé
L’aptitude à la réhydratation est une propriété essentielle des poudres laitières car la plupart d’entre elles sont réhydratées avant usage. Cette opération est généralement effectuée en cuve agitée afin d’obtenir une solution homogène aussi vite que possible. L’objectif de cette étude était de déterminer l’influence de la vitesse d’agitation sur le temps de réhydratation d’une poudre de caséine micellaire. L’évolution de la distribution de taille des particules a été mesurée en fonction du temps au cours d’essais de réhydratation sous différentes conditions d’agitation (400 à 1000 tour·min−1), de température (26 à 30 °C) et de concentration solide/liquide (4,8 à 12 % (p/p)). À partir des évolutions obtenues pour chacune des conditions expérimentales, un temps de réhydratation nécessaire pour atteindre un degré donné de réhydratation a ensuite été déterminé. Enfin, les temps de réhydratation mesurés ont été corrélés aux conditions hydrodynamiques par une relation de procédé découlant des données expérimentales et d’une analyse dimensionnelle. Les résultats obtenus permettent de comparer les effets respectifs d’une augmentation de la température et/ou de l’agitation sur le temps de réhydratation : une augmentation de seulement 4 °C (26 à 30 °C) se traduit par la même diminution du temps de réhydratation qu’un doublement de la vitesse d’agitation (400 à 800 tour·min−1). On peut ainsi conclure à un effet prépondérant de la température sur le processus de réhydratation. La relation de procédé obtenue montre que, pour le mélangeur utilisé, en conditions isothermes et sur les gammes de vitesse d’agitation et de concentration testées, le nombre de révolutions nécessaire pour atteindre un degré de réhydratation donné est indépendant de la vitesse d’agitation. Cependant, ce nombre augmente significativement avec la concentration de la solution lorsque la concentration augmente de 4,8 à 12 %. Ces résultats sont en accord avec la théorie hydrodynamique, la vitesse minimale de mise en suspension des particules croissant avec la concentration.
Key words: rehydration time / micellar casein / mixing / temperature / solid concentration
关键字 : 再水化时间 / 酪蛋白胶束 / 混合 / 温度 / 固形物浓度
Mots clés : temps de réhydratation / caséine micellaire / mélange / température / concentration
© INRA, EDP Sciences, 2009
1. INTRODUCTION
Nowadays, there is a continuous development of innovative dairy-based ingredients that are mainly spray dried to facilitate stabilization during storage [20]. These milk powders are afterwards commonly recombined in mechanically stirred tanks with other components to obtain derived milk products with advanced functional properties (i.e. gelling, foaming, nutrition, etc.) [1, 15].
Rapidly reconstituting milk powders, with a minimum of stirring and without the formation of lumps or undissolved sediments, is an essential end-user powder property because most dairy powders must be completely dissolved before industrial use or be instant for consumers [5, 14, 19]. This ideal behaviour is still difficult to achieve, since a lack of understanding of how rehydration is controlled prevents the manufacturer from achieving this goal.
Powder reconstitution is a complex process that involves several phenomena. It is virtually impossible to list and account all parameters potentially involved in powder rehydration/dissolution process [23]. To mention just a few, powder rehydration/dissolution kinetics is mainly dependent not only on composition and structure of powders but also on the environmental conditions experienced by the powder during storage to the point at which it is rehydrated, physico-chemistry of solid/liquid suspension and process parameters (e.g. impeller rotational speed and temperature).
Numerous models have been proposed for rehydration/dissolution kinetics [6], including empirical/semi-empirical (Weibull function [16]) as well as mechanistically realistic ones (e.g. diffusion [24], swelling [3] and erosion/degradation [22]).
A brief analysis of these particle rehydration/dissolution models shows that severe discrepancies exist between theory and experience and a few of them deal exhaustively with the role of hydrodynamic conditions in rehydration kinetics. Moreover, when such information is available, it can be noted that the impact of stirring condition on dissolution is very often studied by correlating the mass transfer coefficient to operating conditions instead of dissolution time: this mass transfer coefficient is often effective and integrates simultaneously several physical phenomena that are different in nature. Consequently, it is not quite obvious as to how the mixing condition impacts the kinetics and very limited insight into what can be gained through controlling stirring conditions. The aim of this contribution is to fill this gap by determining the influence of stirring conditions (stirrer speed) and temperature on micellar casein powder (MCP) rehydration time. MCP was chosen because of the slow kinetics of rehydration, as previously reported [11, 12, 21]. Static light scattering was used to monitor the evolution of powder particle size distribution during the rehydration of the particles, and cumulative distribution functions were used to determine the rehydration time for the different process conditions that were tested at the pilot scale. Then, rehydration times were correlated to stirring conditions via a process relationship obtained from experimental data and dimensional analysis, which allow analyzing the mixing influence in a tractable fashion.
2. MATERIALS AND METHODS
2.1. MCP
MCP Promilk 872 B1 was provided by Ingredia (Arras, France). It was obtained from 0.1 µm microfiltration of skim milk, followed by spray drying according to [17, 21]. Its biochemical composition was determined in triplicate (Tab. I). Total solids content was calculated by weight loss after drying 1.5 g sample of the powder mixed with sand in a forced air oven at 105 °C for 5 h. Casein, whey protein and nonprotein nitrogen contents were determined according to [2, 18]. Lactose content was determined by enzymatic reactions (Boehringer Mannheim, Biopharm AG, Darmstadt, Germany). Ashes content was measured after incineration at 550 °C for 5 h. Fat content was measured according to [13].
Biochemical composition of the MCP used (mean of three determinations ± standard deviation).
Bulk density was measured according to [4]; its value was 329 kg·m−3.
True density was measured using gas pycnometry with both helium and nitrogen, on a Pycnomatic ATC (Thermo Fisher Scientific, Courtabœuf, France); its value was 1180 kg·m−3.
2.2. Rehydration test
The rehydration experiments were carried out using a 3.5-L jacketed glass vessel (16 cm diameter) that was equipped with one baffle to limit vortex formation. The agitator (8 cm diameter) was a six-pitched blade impeller vertically and centrally mounted; it was driven by a 160 W power electric motor, type RGI 100 (Fisher Bioblock Scientific, Illkirch, France), equipped with a variable-speed drive. The motor-speed drive allowed us to obtain variable speed. The influence of impeller rotational speed (N; rpm) was studied within the range of 400–1000 rpm; it was measured using a digital tachymeter. A picture of the impeller tested is shown in Figure 1.
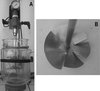 |
Figure 1. Experimental rehydration device. (A) 3.5-L jacketed glass vessel and (B) six-pitched blade impeller. |
Each rehydration experiment was performed according to the following procedure: (i) Rinse the vessel. (ii) Fill the vessel with distilled water. (iii) Heat this solution to the desired temperature (θ; 26–30 °C (± 0.5 °C), depending on the experiments) under the impeller rotational speed studied. (iv) Add MCP manually into the liquid surface at the desired solid/liquid concentrations (φ; w/w), equal to 4.8%, 8% or 12%. During all the experiments, the incorporation protocol and injection zone were kept constant. (v) Start the monitoring of granulometric distribution by sampling 0.5 mL of MCP suspension from the rehydration vessel. The aliquotation was carried out by a 1.6 mm diameter syringe, type BD Discardit II (Becton Dickinson, Le Pont de Claix, France), located halfway between liquid surface and the vessel bottom and about halfway between the vessel wall and the paddle shaft. This aliquotation place was chosen in order to limit the presence of foam in samples, which slightly occurred at the liquid surface. The granulometric distribution was determined by laser light scattering using a Master Sizer 2000 (Malvern Instruments, Malvern, UK) equipped with a 5 mW He-Ne laser operating at a wavelength of 633 nm. Then, the samples were diluted into the Malvern cell (volume: 100 mL) with distilled water in order to reach the correct obscuration (25%). Refractive index taken for solvent, particle and adsorption was 1.33, 1.15 and 0.1, respectively. The granulometric distribution was measured every 5 min during the first hour and then every 30 min until the end of the experiment. The reproducibility of the results was estimated at both solid/liquid concentrations 4.8% and 8% by repeating some experiments. (vi) Empty the vessel, rinse twice with water at 40 °C and wash with alkaline solution (RBS 35 MD, Chemical Products, Brussels, Belgium; 2% (w/w)). (vii) The system is ready for the next experiment.
2.3. Curve fitting
The monitoring of granulometric distribution allowed us to obtain the evolution of d0.5 diameter, calculated from the Mie theory, over time. The mean d0.5 initial value was equal to 60 μm, corresponding to what can be expected for a nonagglomerated MCP.
Then, the normalized particle diameter d* was represented as a function of time: (1)
(1)
where d 0 and d ∞ are the mean initial (60 μm) and final (0.23 μm) d0.5 diameters measured on the entire set of experiments. d* is a normalized diameter varying from 0 at t = 0 to 1 at t = ∞, which represents the so-called degree of rehydration or rehydration rate.
The evolution of rehydration rate d* with time (rehydration curve) was fitted by a polynomial function. At this stage, it is clear that a two-parameter sigmoid function could be convenient and expected in order to fit the shape of the curve; nevertheless, the polynomial function fitting was preferred to guarantee a good agreement between model and experimental data, which was not possible with sigmoid function during the whole course of the rehydration process.
Then, for each [φ, N, θ] condition, the rehydration time t rX was determined from the rehydration curve. The rehydration time t rX is defined as the time required to achieve a predetermined value X of rehydration rate d* since the manual addition of MCP.
An example of such a fit and rehydration time t rX determination is given in Figure 2 (φ = 8%; N = 500 rpm; θ = 30 °C). It can be seen that d0.5 diameter decreases over time from its initial value (60.3 ± 1.2 μm), representative of the powder particle diameter, to a final value (0.21 μm) that is close to the casein micelles dimensions. For the conditions tested in this experiment, the rehydration time t r0.9 corresponding to a rehydration rate d* equal to 0.9 is 32 242 s.
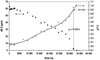 |
Figure 2. d0.5 and d* as a function of time during rehydration of MCP at a concentration φ of 8% (w/w), 30 °C and 500 rpm. ▲: d0.5 value; ◊: corresponding d* value calculated from equation (1); black line stands for polynomial model. |
3. RESULTS AND DISCUSSION
3.1. Effect of stirring on the rehydration process under isotherm conditions and at fixed solid concentration
Figure 3 shows the evolution of d* as a function of time for different stirring speeds N (400, 500, 600, 800 and 1000 rpm) and fixed solid concentration and temperature (equal to 4.8% [w/w] and 30 °C, respectively). Qualitatively and as expected, it can be noted that increasing the stirring speed leads to a faster rehydration kinetics.
 |
Figure 3. Rehydration rate d* as a function of time and stirring speed N (rpm). ♦: N = 400 rpm; ○: N = 500 rpm; ●: N = 600 rpm; ◊: N = 800 rpm; ▲: N = 1000 rpm. Black line stands for polynomial model. Fixed φ and θ values are equal to 4.8% (w/w) and 30 °C, respectively. |
Figure 4 gives a quantitative representation of the dependence of the rehydration time on stirring speed. Here, the rehydration time t rX was determined for different degrees of rehydration X from the rehydration kinetics as previously described in the Section 2, and plotted versus stirring speed. From this figure, it also appears that t rX is strongly influenced by the stirring speed. Indeed, for the operating conditions tested (range of stirring speed, powder type, solid concentration and temperature values), the rehydration time t rX seems to be inversely proportional to stirring speed N whatever the degree of rehydration considered. Moreover, the magnitude of stirring speed strongly influences the rehydration time, whatever the degree of rehydration considered. For example, for the degree of rehydration X = 0.7, the rehydration time t r0.7 is divided by 1.8 when doubling the stirring speed. As the accuracy of the method used to determine the characteristic rehydration time seems higher at d* equal to 0.7, t r0.7 will be preferred in further considerations.
 |
Figure 4. Rehydration time t rX as a function of stirring speed N (rpm). ♦: X = 0.3; ◊: X = 0.5; ▲: X = 0.7; ∆: X = 0.9. Fixed φ and θ values are equal to 4.8% (w/w) and 30 °C, respectively. |
3.2. Effect of solid concentration on the experimental rehydration time
In this part, rehydration time data obtained for different suspensions with solid-liquid concentrations ranging from 4.8% to 12% (w/w) will be discussed. Figure 5 shows the evolution of t r0.7 with stirring speed for three different solid concentrations that are represented by distinguished symbols. In this figure, each point plotted is the result of a rehydration experiment that was carried out under isothermal conditions and various stirring speeds. The reproducibility of the results was satisfactory, as the experimental error (standard deviation over average value) was below 6.0% whatever the conditions tested in replicate (600 and 700 rpm) or triplicate (400 rpm) at 8% solid concentration (empty diamonds; Fig. 5).
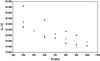 |
Figure 5. Rehydration time t r0.7 as a function of stirring speed N (rpm) for different solid-liquid concentrations φ (w/w). ♦: φ = 4.8%; ◊: φ = 8%; ▲: φ = 12%. Fixed θ value is equal to 30 °C. |
It can be seen that the influence of solid concentration on t r0.7 is weak within the range from 4.8% to 8%, and more pronounced for solid concentration equal to 12%, especially at low stirring speed. These results seem to be consistent with the hydrodynamic theory. Indeed, when computing just suspended stirring speed N js for mixing system according to the Zwietering correlation [25], we obtained an impeller rotational speed ranging from 309 to 345 rpm depending on φ. These values explain why the influence of solid concentration on the rehydration time is stronger when the impeller rotational speed is low, i.e. closer to N js. Indeed, the minimal impeller rotational speed studied here (400 rpm) is of the same magnitude as N js, which can explain the higher t r0.7 observed at higher solid concentration.
3.3. Effect of the temperature on the rehydration kinetics and the rehydration time
Temperature is known to greatly affect the rehydration of milk powders in stirred tanks, as previously reported by Fitzpatrick and Cuthbert [10]. In order to compare quantitatively the respective influences of temperature and stirring speed on the rehydration process, a 22 factorial design was undertaken at a solid concentration of 4.8%. Table II reports the rehydration time obtained at a rehydration rate equal to 0.7 for stirring speed and temperature ranging from 400 to 800 rpm and 26–30 °C, respectively. For fixed impeller rotational speed, it can be observed that increasing the temperature leads to a faster rehydration kinetics, i.e. a lower t r0.7 value. From these results, the normalized effects of stirring rate, temperature and interaction between stirring rate and temperature on t r0.7 were calculated (Tab. III). The confidence interval C 0.05 at P ≤ 0.05 level of each effect was determined from the results obtained at central point (N = 600 rpm; θ = 26 °C), realized in replicate.
Rehydration time t r0.7 (s) obtained for a fixed rehydration rate of 0.7 and different temperatures (θ) and stirring speeds (N).
Normalized effects (s) of stirring rate, temperature and interaction between stirring rate and temperature on t r0.7.
For the parameter ranges investigated, temperature and stirring rate normalized effects on t r0.7 are significant at P ≤ 0.05 level and are of the same magnitude. However, one should consider that the temperature range investigated here corresponds to an increase of only 4 °C, whereas the stirring rate is doubled at the same time. Therefore, temperature effect on rehydration behaviour is clearly more pronounced than the one of stirring speed. Moreover, the positive and significant interaction between temperature and stirring speed (N × θ, Tab. III) strengthens the influence of temperature at low rotational speed. As an example, an increase of the temperature from 26 to 30 °C leads to a decrease of t r0.7 of 58 643 s at 400 rpm and 5441 s at 800 rpm (Tab. II).
3.4. Correlation between mixing condition and rehydration time at constant temperature
The dissolution rate of solids and its link with agitation condition is not a new topic [9]. In spite of the progress made in this field, a satisfactory prediction of the rehydration time of a powder is not, in general, possible at the present time.
Particularly great difficulties arise from the fact that (i) lot of physico-chemical properties affect the mass transfer and the ways the rehydration mechanisms and mass transport occur and (ii) few experimental data concerning rehydration times are available in the literature. Surprisingly, in spite of its importance, the rehydration time of powder is not a parameter that has been often measured. However, it could be deduced from experimental dissolution curves similarly as a mixing time can be obtained from a mixing curve [7]. The target parameter generally monitored in dissolution phenomena is mass transfer coefficient. This parameter is useful for comparing the agitation efficiency but unfortunately, it is not always obvious to integrate it in a mass transfer model and as a consequence, to predict the variation of rehydration time with stirring conditions. The purpose of this part is to discuss the possibilities of building relationship directly between rehydration time and stirring conditions. Our theoretical analysis will start by making a dimensional analysis between the rehydration time, taking into account the target parameters and mixing conditions.
3.4.1. Dimensional analysis of rehydration time
When mixing solid/liquid suspension in a given agitated vessel (Fig. 6), the rehydration time t rX corresponding to a degree of rehydration X depends on the parameters of the fluid (density ρ and dynamic viscosity μ), the powder particles (density ρp, concentration φ and particle diameter d p), the diffusion coefficient D, the gravitational acceleration g and the stirring speed N.
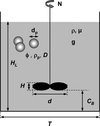 |
Figure 6. Classical geometric parameters and notations used for mixing vessel equipped with a stirrer vertically and centrally mounted in a tank. |
The above-mentioned dependency on dimensional parameters F
1 (t
rX
, d, T, H, C
B, H
L, d
P, ρP, μ, ρ, φ, D, N, g) = 0 leads, by way of dimensional analysis, to the following dependency  , where ΘrX
= N·t
rX
is a rehydration time number, Re is the Reynolds number, Fr is the Froude number and Sc is the Schmidt number. For a given powder, a given agitator, fixed installation and temperature conditions and when no vortex is occurring, the dimensional analysis is further reduced to a dependence between ΘrX
, Re and φ:
, where ΘrX
= N·t
rX
is a rehydration time number, Re is the Reynolds number, Fr is the Froude number and Sc is the Schmidt number. For a given powder, a given agitator, fixed installation and temperature conditions and when no vortex is occurring, the dimensional analysis is further reduced to a dependence between ΘrX
, Re and φ:  (2)
(2)
3.4.2. Process relationship of rehydration time
Rehydration time data obtained with MCP with the mixing system studied are shown in Figure 7. Results are presented in terms of the dimensionless numbers (Θr0.7 versus Re) that were previously defined in equation (2). Each point plotted in the rehydration time curve (Fig. 7) is the result of a rehydration process and as previously, t r0.7 is deduced from the evolution of rehydration rate d* with time. The different symbols correspond to various solid concentration values. For each solid concentration and for 40 000 < Re < 100 000, Θr0.7 is constant and independent of the Re number. This means that for the range of process conditions tested, the revolution number of the impeller ΘrX to achieve a given rehydration degree X is constant. This confirms fairly well the previous comments concerning Figure 4 that the rehydration time t rX can be considered as inversely proportional to stirring speed N.
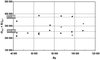 |
Figure 7. Rehydration time number Θr0.7 = N·t r0.7 as a function of the Re number. ♦: φ = 4.8%; ◊: φ = 8%; ▲: φ = 12%. |
Note that the value of Θr0.7 is not always independent of solid concentration φ value. Indeed, it seems that Θr0.7 value is higher at high φ value. For 4.8% ≤ φ ≤ 8%, the value of Θr0.7 was found to be equal to 255 000 (confidence interval C 0.05 at P ≤ 0.05 level: ± 61 000). For φ = 12%, the value of Θr0.7 was significantly higher at P ≤ 0.05 level and equal to 373 000 (confidence interval C 0.05 at P ≤ 0.05 level: ± 42 000).
Experimental results of rehydration time for our rehydration device suggest that it is only the number of revolutions achieved by the impeller which governs the rehydration rate. There exists here an analogy with the results obtained for mixing time and axial circulation time when homogenizing single phase liquids with other mixing equipment [7, 8]. It is difficult at this stage to compare this result because of the lack of similar approach and data in this field. Of course, it needs to be confirmed and enlarged to other suspension, mixing equipment and operating conditions. This will be done in further studies.
4. CONCLUSIONS
In this paper, the rehydration process of MCP in an agitated vessel was studied. In particular, the effect of temperature, solid concentration and mixing conditions was investigated. It has been shown that for the range of process conditions tested, the solid concentration only slightly affects the rehydration process. On the contrary, impeller rotational speed and moreover temperature strongly influence the rehydration kinetics. Therefore, we recommend to increase, when possible, first the temperature and second the impeller rotational speed in order to shorten the reconstitution time of dairy powders.
Moreover, a method has been developed to determine from the granulometric curve the rehydration time corresponding to various degrees of rehydration. Then, a dimensional analysis has been proposed to link rehydration time to solid/liquid concentration and hydrodynamic conditions. Experimental measurements allowed us to obtain the shape of the process relationship. It appears that the revolution number achieved by the agitator governs the rehydration rate. This result is similar to those obtained with characteristic times (mixing and circulation) in mixing operations. Its robustness will be tested further, on extended ranges of process parameters (temperature, solid concentration and flow regime), other mixing equipment (impeller geometry) and dairy powders.
Acknowledgments
The authors are indebted to the scientific committee of CNIEL Recherche (Paris, France) for stimulating discussions and financial support. They thank J. Cohen Solal and P. Wilpote for their valuable help in experimental work.
References
- Aneja R.P., Equipment for recombination, IDF Special issue 9001, Recombination of Milk and Milk Products Conference, Int. Dairy Fed, Brussels, Belgium, 1990, pp. 186–195. [Google Scholar]
- Aschaffenburg R., Drewry J., New procedure for the routine determination of the various non casein proteins of milk, in: Proceedings of the 15th Int. Dairy Congr., London, UK, vol. 3, Int. Dairy Fed., Brussels, Belgium, 1959, pp. 1631–1637. [Google Scholar]
- Brazel C., Peppas N., Modeling of drug release from swellable polymers, Eur. J. Pharm. Biopharm. 49 (2000) 47–58. [CrossRef] [PubMed] [Google Scholar]
- Carr R.L. Jr., Evaluating flow properties of solids, Chem. Eng. 72 (1965) 163–168. [Google Scholar]
- Cayot P., Lorient D., Les propriétés d’hydratation des protéines, Structures et technofonctions des protéines du lait, Arilait Recherches, Tec & Doc (1998), Lavoisier, Paris, France, pp. 209–227. [Google Scholar]
- Costa P., Sousa Lobo J.M., Review: modeling and comparison of dissolution profiles, Eur. J. Pharm. Sci. 13 (2001) 123–133. [CrossRef] [PubMed] [Google Scholar]
- Delaplace G., Leuliet J.C., Relandeau V., Circulation and mixing times for helical ribbon impellers. Review and experiments, Exp. Fluids 28 (2000) 170–182. [CrossRef] [Google Scholar]
- Delaplace G., Thakur R.K., Bouvier L., André C., Torrez C., Dimensional analysis for planetary mixer: mixing time and Reynolds numbers, Chem. Eng. Sci. 62 (2007) 1442–1447. [CrossRef] [Google Scholar]
- Dokoumetzidis A., Macheras P., A century of dissolution research: from Noyes and Whitney to the Biopharmaceutics Classification System, Int. J. Pharm. 321 (2006) 1–11. [CrossRef] [PubMed] [Google Scholar]
- Fitzpatrick J.J., Cuthbert R., Effect of temperature on the reconstitution of milk powder to high solids content in a stirred-tank, Milchwissenschaft 59 (2004) 55–58. [Google Scholar]
- Gaiani C., Banon S., Scher J., Schuck P., Hardy J., The dissolution behaviour of native phosphocaseinate as a function of concentration and temperature using a rheological approach, Int. Dairy J. 16 (2006) 1427–1434. [CrossRef] [Google Scholar]
- Gaiani C., Schuck P., Scher J., Desobry S., Banon S., Dairy powder rehydration: influence of protein state, incorporation mode, and agglomeration, J. Dairy Sci. 90 (2007) 570–581. [CrossRef] [PubMed] [Google Scholar]
- IDF-FIL, Dried milk, dried whey, dried buttermilk & dried butter serum: determination of fat content – Röse Gottlieb reference method, IDF Standard 9C, Int. Dairy Fed, Brussels, Belgium, 1987. [Google Scholar]
- King N., Dispersibility and reconstitutability of dried milk, Dairy Sci. Abstract 28 (1966) 105–118. [Google Scholar]
- Maubois J.L., Ollivier G., Extraction of milk proteins, in: Damodaran S., Paraf A. (Eds.), Food proteins and Their Applications, M. Dekker, New York, USA, 1997. [Google Scholar]
- Papadopoulou V., Kosmidis K., Vlachou M., Macheras P., On the use of the Weibull function for the discernment of drug release mechanisms, Int. J. Pharm. 309 (2006) 44–50. [CrossRef] [PubMed] [Google Scholar]
- Pierre A., Fauquant J., Le Graët Y., Piot M., Maubois J.L., Préparation de phosphocaséinate natif par microfiltration sur membrane, Lait 72 (1992) 461–474. [CrossRef] [EDP Sciences] [Google Scholar]
- Rowland S.J., The determination of nitrogen distribution in milk, J. Dairy Res. 9 (1938) 42–46. [CrossRef] [Google Scholar]
- Schubert H., Instantization of powdered food products, Int. Chem. Eng. 33 (1993) 28–44. [Google Scholar]
- Schuck P., Spray drying of dairy products: state of the art, Lait 82 (2002) 375–382. [CrossRef] [EDP Sciences] [Google Scholar]
- Schuck P., Piot M., Mejean S., Le Graët Y., Fauquant J., Brulé G., Maubois J.L., Déshydratation par atomisation de phosphocaséinate natif obtenu par microfiltration sur membrane, Lait 74 (1994) 375–388. [CrossRef] [EDP Sciences] [Google Scholar]
- Siepmann J., Göpferich A., Mathematical modeling of bioerodible, polymeric drug delivery systems, Adv. Drug Delivery Rev. 48 (2001) 229–247. [CrossRef] [Google Scholar]
- Siepmann J., Siepmann F., Review: mathematical modelling of drug delivery, Int. J. Pharm. 364 (2008) 328–343. [CrossRef] [PubMed] [Google Scholar]
- Wang J., Flanagan D.J., General solution for diffusion-controlled dissolution of spherical particles. 1. Theory, J. Pharm. Sci. 88 (1999) 731–738. [CrossRef] [PubMed] [Google Scholar]
- Zwietering T.N., Suspending of particles in liquid by agitators, Chem. Eng. Sci. 8 (1958) 244–253. [CrossRef] [Google Scholar]
Nomenclature
Letters
C 0.05 : confidence interval at P ≤ 0.05 level
C B : bottom clearance (m)
d0.5: mean powder particle diameter calculated from the granulometric distribution (μm)
d*: normalized particle diameter or rehydration rate
d : agitator diameter (m)
D : diffusion coefficient (m2·s−1)
Fr : Froude number (–)
g : gravitational acceleration (m·s−2)
H : rehydration solution level (m)
H L : agitator height (m)
N : stirring speed (rpm)
N js : just suspended stirring speed (rpm)
Re : Reynolds number (–)
Sc : Schmidt number (–)
t rX : time required to achieve a predetermined value X of rehydration rate d* (s)
T : vessel diameter (m)
Greek symbols
φ: solid/liquid concentration (w/w·%)
μ: dynamic viscosity (Pa·s)
θ: temperature (°C)
ΘrX : rehydration time number (–)
ρ: density (kg·m−3)
All Tables
Biochemical composition of the MCP used (mean of three determinations ± standard deviation).
Rehydration time t r0.7 (s) obtained for a fixed rehydration rate of 0.7 and different temperatures (θ) and stirring speeds (N).
Normalized effects (s) of stirring rate, temperature and interaction between stirring rate and temperature on t r0.7.
All Figures
|
Figure 1. Experimental rehydration device. (A) 3.5-L jacketed glass vessel and (B) six-pitched blade impeller. |
| In the text | |
|
Figure 2. d0.5 and d* as a function of time during rehydration of MCP at a concentration φ of 8% (w/w), 30 °C and 500 rpm. ▲: d0.5 value; ◊: corresponding d* value calculated from equation (1); black line stands for polynomial model. |
| In the text | |
|
Figure 3. Rehydration rate d* as a function of time and stirring speed N (rpm). ♦: N = 400 rpm; ○: N = 500 rpm; ●: N = 600 rpm; ◊: N = 800 rpm; ▲: N = 1000 rpm. Black line stands for polynomial model. Fixed φ and θ values are equal to 4.8% (w/w) and 30 °C, respectively. |
| In the text | |
|
Figure 4. Rehydration time t rX as a function of stirring speed N (rpm). ♦: X = 0.3; ◊: X = 0.5; ▲: X = 0.7; ∆: X = 0.9. Fixed φ and θ values are equal to 4.8% (w/w) and 30 °C, respectively. |
| In the text | |
|
Figure 5. Rehydration time t r0.7 as a function of stirring speed N (rpm) for different solid-liquid concentrations φ (w/w). ♦: φ = 4.8%; ◊: φ = 8%; ▲: φ = 12%. Fixed θ value is equal to 30 °C. |
| In the text | |
|
Figure 6. Classical geometric parameters and notations used for mixing vessel equipped with a stirrer vertically and centrally mounted in a tank. |
| In the text | |
|
Figure 7. Rehydration time number Θr0.7 = N·t r0.7 as a function of the Re number. ♦: φ = 4.8%; ◊: φ = 8%; ▲: φ = 12%. |
| In the text | |