| Issue |
Dairy Sci. Technol.
Volume 89, Number 3-4, May-August 2009
1st IDF/INRA International Symposium on Minerals and Dairy Products
|
|
|---|---|---|
| Page(s) | 387 - 403 | |
| DOI | https://doi.org/10.1051/dst/2009020 | |
| Published online | 29 May 2009 | |
Original article
Physico-chemical changes in casein micelles of buffalo and cow milks as a function of alkalinisation碱化作用对水牛乳和牛乳酪蛋白胶束物理化学性质的影响
Modifications physico-chimiques des micelles de caséines du lait de vache et du lait de bufflesse en fonction de l’alcalinisation
Sarfraz Ahmad1, Michel Piot1, Florence Rousseau1, Jean François Grongnet2 and Frédéric Gaucheron1*
1 INRA, UMR1253 Science et Technologie du Lait et de l’Œuf, 65 rue de Saint Brieuc, 35042 Rennes Cedex, France
2 AGROCAMPUS OUEST, 65 rue de Saint Brieuc, 35042 Rennes Cedex, France
* Corresponding author (通讯作者): This email address is being protected from spambots. You need JavaScript enabled to view it.
Received: 14 November 2008
Accepted: 16 April 2009
By modifying the forces (hydrophobic and electrostatic interactions, hydrogen bonding and presence of micellar calcium phosphate) responsible for the structure and the stability of casein micelles, alkalinisation induces a disruption of casein micelles in milk. The objective of this work was to compare the alkalinisation-induced physico-chemical changes of casein micelles of buffalo and cow milks with a special attention to the mineral fraction. The whiteness and viscosity were determined as global characteristics of milk. The aqueous and micellar phases of milks were ascertained for the distributions of the concentrations of nitrogen, casein molecules, calcium, inorganic phosphate and water as their supramolecular and molecular characteristics. These parameters were measured at six pH values between pH 6.7 and 10.8. Between pH 6.7 and 10.8, the whiteness decreased from 73.5 to 50.9 and from 71.3 to 50.9 units and the viscosity increased from 1.8 to 10.2 and from 1.5 to 4.8 mPa·s for buffalo and cow milks, respectively. Simultaneously, > 90% of nitrogen contents were in the supernatants of ultracentrifugation at pH 9.7 and 8.6 for buffalo and cow milks, respectively. Chromatographic analyses showed that caseins were totally solubilised at these pH values. Calcium and inorganic phosphate concentrations progressively increased in the supernatants of ultracentrifugation and decreased in the ultrafiltrates. At alkaline pH, the negative charge of caseins increased and the inorganic phosphate ion changed its ionisation state from HPO42− to PO43− form. This form has a greater affinity for calcium and can demineralise casein micelles. The consequences were modifications of protein-protein and protein-minerals interactions resulting in micellar disruption. The dissociations took place at pH 9.7 and 8.6 for buffalo and cow milks, respectively. These differences were due to higher concentrations of casein and minerals in buffalo than in cow milk, which were also our criteria of selection of the former as a model.
摘要
分子间作用力 (疏水和静电作用、氢键和胶束磷酸钙的存在) 的改变会影响酪蛋白胶束的结构和稳定性,碱化作用使得乳中酪蛋白胶束破坏. 本研究比较了碱化作用对水牛乳和牛乳物理化学性质和酪蛋白胶束中矿物元素的影响. 以白度和黏度作为综合指标来评价乳的表观特性. 并测定了乳水相和胶束相中氮、酪蛋白分子、钙、无机磷酸盐和水分的分布. 这些参数的测定是在 pH 6.7–10.8 (6个pH间隔). 在 pH 6.7–10.8, 水牛乳的白度从 73.5单位 降到 50.9单位,牛乳的白度从 71.3 单位降到 50.9单位,而水牛乳的黏度从 1.8 mPa·s增加 10.2 mPa·s,牛乳的黏度从 1.5 mPa·s增加到 4.8 mPa·s. 同时,水牛在乳 pH 9.7和牛乳在 pH 8.6时, 高于90%的氮存在于水相中. 色谱分析表明在这些pH值下,酪蛋白完全是可溶的. 在水相中钙和无机磷酸盐的浓度增加而在胶体相中含量降低. 在碱性 pH 下,酪蛋白的负电荷增加,无机磷酸盐从 HPO42− 转变成PO43−. PO43− 与钙形成不溶性的磷酸钙,导致了酪蛋白胶束中钙的溶解. 结果是蛋白-蛋白和蛋白-矿物元素之间的作用发生改变,进而导致胶束的破坏. 水牛乳在 pH 9.7 和牛乳在 pH 8.6 时,酪蛋白胶束完全解聚,这种解聚pH的不同是由于水牛乳酪蛋白和钙的浓度高于牛乳.
Résumé
En modifiant les forces qui interviennent dans la structure et la stabilité des micelles de caséines (interactions hydrophobes et électrostatiques, liaisons hydrogène et présence de phosphate de calcium micellaire), l’alcalinisation du lait induit une dissociation des micelles de caséines. L’objectif de ce travail était de comparer les changements physico-chimiques et particulièrement la fraction minérale des micelles de caséines induits par l’alcalinisation de laits de bufflesse et de vache. La blancheur et la viscosité étaient déterminées comme caractéristiques globales du lait. Les distributions entre phases aqueuses et micellaires des concentrations en azote, molécules de caséines, calcium, phosphate inorganique et eau étaient déterminées comme caractéristiques supramoléculaires et moléculaires. Ces paramètres étaient mesurés à six valeurs de pH compris entre pH 6,7 et 10,8. Entre pH 6,7 et 10,8, la blancheur diminuait de 73,5 à 50,9 et de 71,3 à 50,9 unités alors que la viscosité augmentait de 1,8 à 10,2 et de 1,5 à 4,8 mPa·s pour les laits de bufflesse et de vache, respectivement. Dans le même temps, plus de 90 % des concentrations en azote étaient dans les surnageants d’ultracentrifugation des laits de bufflesse et de vache à pH 9,7 et 8,6, respectivement. Les analyses chromatographiques ont montré que les caséines étaient totalement solubilisées à ces valeurs de pH. Les concentrations de calcium et de phosphate inorganique augmentaient progressivement dans les surnageants d’ultracentrifugation et diminuaient dans les ultrafiltrates. À pH alcalin, la charge négative des caséines augmente et l’ion phosphate change son état d’ionisation en passant de la forme HPO42− à la forme PO43−. Cette forme a une forte affinité pour le calcium et peut déminéraliser les micelles de caséines. Les conséquences étaient des modifications dans les interactions protéines-protéines et protéines-minéraux conduisant à une dissociation micellaire. Les dissociations étaient respectivement atteintes à pH 9,7 et 8,6 pour les laits de bufflesse et de vache. Ces différences quantitatives étaient dues aux plus fortes concentrations de caséines et de minéraux dans le lait de bufflesse par rapport au lait de vache, ce qui correspondait à nos critères de choix de ce lait comme modèle.
Key words: casein micelle / buffalo milk / cow milk / mineral / alkalinisation
关键字 : 酪蛋白胶束 / 水牛 / 奶牛 / 矿物元素 / 碱化作用
Mots clés : micelles de caséine / lait de bufflesse / lait de vache / minéraux / alcalinisation
© INRA, EDP Sciences, 2009
1. INTRODUCTION
Casein micelles consist of 94% of caseins (αS1, αS2, β- and κ-CN) and 6% of inorganic constituents corresponding to micellar calcium phosphate. Hydrophobic and electrostatic interactions, hydrogen bonding and presence of calcium phosphate linked to casein molecules are the forces responsible for the structure and the stability of casein micelle. Cleavage of these forces by pH decrease, addition of calcium chelatants or urea, cooling, high pressure treatment and alkalinisation induce disruption of micelles into smaller units [24, 25].
Some studies show that alkalinisation leads to a reduction in the turbidity of milk [21, 23] to become transparent as whey at pH close to 9 [22, 23]. Other authors indicate that milk alkalinisation induces a gelation of casein dispersion [14, 18]. Rose [19] found an increase in casein concentration in the serum above pH 7. Vaia et al. [20] determined decreases in concentrations of calcium (Ca) (particularly ionic Ca) and inorganic phosphate (Pi) in the aqueous phase with increasing pH. As per these authors, such decreases in ionic concentrations improve the solvent quality and facilitate the dissociation of casein micelles. According to the same authors, this dissociation is due to diminished cohesive interaction between the hydrophobic regions of caseins resulting in disrupted casein micelles. In addition to mineral changes in the aqueous phase, Huppertz et al. [6] and Vaia et al. [20] explain that the changes in the ionisation of proteins can also contribute to this disruption.
The objective of this work was to study the evolution of physico-chemical properties of casein micelles and to propose a mechanism of the disruption of casein micelles induced by alkalinisation with a special attention paid to the mineral fraction. In this case, alkalinisation is used as a way to identify the factors that are involved in the structure and stability of casein micelles. The changes were compared between buffalo and cow milks. Buffalo milk was selected because of its higher concentration of casein micelles than cow milk. Moreover, the casein micelles in buffalo milk are more mineralised and less hydrated than those in cow milk [1].
2. MATERIALS AND METHODS
2.1. Samples preparation
Partially skimmed milks of both species were prepared by centrifugation at 2000× g for 10 min at 20 °C. Thimerosal 0.3 g·L−1 (Sigma-Aldrich, St Louis, USA) was added in both milks as a preservative against microorganisms. The global composition of the partially skimmed milks of both species was with 8.4 and 7.7 g·kg−1 of fat, 45.4 and 32.4 g·kg−1 of total proteins and 55.0 and 50.0 g·kg−1 of lactose for buffalo and cow milks, respectively.
Samples were alkalinised at approximate pH 7, 8, 9, 10 and 11 by the addition of 1 mol·L−1 NaOH under vigorous stirring at 20 °C (in addition to the control sample that was unmodified). The dilution caused by the NaOH addition was kept constant by adding an appropriate volume of Milli-Q water. Before analysis, the samples were left overnight at room temperature.
2.2. Preparation of supernatants of ultracentrifugation, ultrafiltrates and micellar pellets
Control and alkalinised samples were ultracentrifuged at 100 000× g during 1 h (Sorvall, Discovery 90SE, Hitachi, Newtown, USA) at 20 °C with a T-865 rotor. One part of the supernatant was kept for compositional measurements and the rest was ultrafiltered at 20 °C with a membrane Vivaspin 20 (Vivascience – Sartorius group, Goettingen, Germany), (molecular weight cut-off: 10 000 g·mol−1) at 1800× g for 2 h in a centrifuge SV 11 TH (Firlabo, Lyon, France). Ultrafiltrates were used for compositional measurements and physico-chemical characterisations. Micellar pellets were drained to measure micellar hydration.
2.3. Physico-chemical characteristics of milks
2.3.1. Evolution of pH as a function of NaOH added
The pH values were measured as a function of NaOH added. The volumes of 1 mol·L−1 NaOH used to get the same desired pH in both milks were noted. The experimental error of pH measurement was ± 0.02.
2.3.2. Whiteness
A microcolor tristimulus colorimeter (Minolta chromameter CR-300, Carrières-sur-Seine, France) was used for measurement. Calibration was performed using the Minolta calibration plate (standard tristimulus values: Y = 92.4; x = 0.3161; y = 0.3325). In this system, L value defines the position of the samples on the light-dark axis [11]. The experimental error was ± 0.1 arbitrary units.
2.3.3. Viscosity
The equipment was composed of a viscometer with co-axial cylinders (Low shear 30, Contraves, Switzerland) whose double-walled external cylinder served as a thermostat [12]. At the bottom of the external cylinder, a refractometer Sopelem (Paris, France) had been fixed. The gradient of the speed of viscometer was kept as 1267 s−1 for all experiments. The experimental error was ± 0.05 mPa·s.
2.4. Physico-chemical characteristics of casein micelles
2.4.1. Size distribution of particles
Size distribution of particles was determined by injecting milk (500 μL) directly into the Mastersizer 2000 granulometer (Malvern Instruments Ltd., Worcestershire, UK) that contained Milli-Q water (~ 100 mL) under a 1500 rpm stirring at 20 °C. Measurements were performed through diffraction of light with He-Ne laser having 633 nm wavelength. Refractive indices were 1.333 and 1.570 for water and casein micelles, respectively [3].
2.4.2. Micellar hydration
The casein pellets obtained by ultracentrifugation were weighed and then dried at 103 °C for 7 h. The difference in weight before and after drying, expressed as g H2O·g−1 dry pellet, was taken as the micellar hydration. The experimental error was ± 0.05 g.
2.4.3. Protein contents in supernatants of ultracentrifugation
Samples to determine total nitrogen content in the supernatants of ultracentrifugation were prepared according to the IDF protocol [7] and were determined using Kjeldahl method [8]. Nitrogen content was converted into protein content using 6.38 as conversion factor [10]. The experimental error was ± 0.1 g.
2.4.4. Chromatographic profiles of proteins in milks and supernatants of ultracentrifugation
The proteins present in milks and supernatants of ultracentrifugation were analysed by reverse-phase high-performance liquid chromatography (RP-HPLC). Before the analysis, samples were reduced by 10 mmol·L−1 dithiothreitol in the presence of 8 mol·L−1 urea, 44 mmol·L−1 trisodium citrate and 100 mmol·L−1 Tris-HCl (pH 8) for 1 h at 37 °C, then diluted with 0.3% (v/v) trifluoroacetic acid (TFA) (adequate dilution to reach pH 2) and filtered through 0.45 μm Acrodisc filter (Labo Standa, Caen, France). The amount of the sample injected into RP-HPLC was 100 μL. Separations were carried out on a 15 cm Vydac C4 column 214 TP 54 (Touzart et Matignon, Les Ulis, France). The chromatographic conditions were as described by Jaubert and Martin [9] with slight modifications. Solvents were composed of 0.106% (v/v) TFA in water (solvent A) and 0.1% (v/v) TFA in 80% (v/v) acetonitrile (solvent B). For protein separation, elution was achieved using a linear gradient of solvent B from 37% to 56% for 44 min, from 56% to 100% for the next 4 min and then from 100% to 37% for the next 11 min (the total analysis time for each sample was 59 min) at a flow rate of 1 mL·min−1. The wavelength for the detection was 214 nm. The protein fractions considered were κ-CN + αS2-CN, αS1-CN, β-CN and β-lactoglobulin (β-Lg). Results were also expressed by the ratio of HPLC area of protein fractions in the supernatants of ultracentrifugation of alkalinised milk to HPLC area of protein fractions in the control milk. The experimental error on the chromatographic area was ± 5%.
2.4.5. Mineral analysis of milks, supernatants of ultracentrifugation and ultrafiltrates
Ca and Na concentrations were measured by atomic absorption spectrometry (Varian 220FS Spectr AA, Les Ulis, France) [13]. Pi concentration was determined using ion chromatography coupled with suppressed conductivity detection (Dionex DX 500, Dionex, Voisin-le-Bretonneux, France) [2]. Ion concentrations determined in the ultrafiltrates were converted into diffusible concentrations by multiplying with a correction factor 0.96 [17]. This correction took into account the volume effect of proteins present in milk but excluded in the ultrafiltrates of milk due to retention on membranes. The experimental error for all minerals was ± 1%.
3. RESULTS
3.1. Physico-chemical characteristics of milk
3.1.1. Evolution of pH as a function of NaOH added
In comparison with cow milk, buffalo milk required more alkali to attain the same pH level (Fig. 1A). For example, to attain pH 9.7, 6 and 5 mL of 1 mol·L−1 NaOH were added in buffalo and cow milks, respectively.
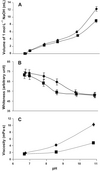 |
Figure 1. pH evolution (A), whiteness (B) and viscosity (C) of buffalo (♦) and cow (■) milks as a function of alkalinisation. |
3.1.2. Whiteness
At pH 6.7, buffalo milk was slightly whiter than cow milk. Then, alkalinisation induced a decrease in the whiteness of both milks (Fig. 1B). The decrease was slower in buffalo milk than in cow milk, but finally at pH 10.8, the values were similar for both milks.
3.1.3. Viscosity
At pH 6.7, buffalo milk was slightly more viscous than cow milk. Then, the viscosities increased for both milks during their alkalinisation (Fig. 1C). At pH 8.6 and 10.8, viscosities of buffalo milk were two times higher than those of cow milk.
3.2. Physico-chemical characteristics of casein micelles
3.2.1. Size distribution of particles
At pH 6.7, two populations with respect to the size of particles were determined for both milks. The first (between 0.03 and 0.40 nm) corresponded to casein micelles and the second (between 0.7 and 6 μm) to fat globules (Fig. 2). The presence of fat globules was confirmed through observations using an optical microscope (results not shown).
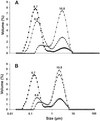 |
Figure 2. Size distribution profiles of particles of buffalo (A) and cow (B) milks as a function of alkalinisation. |
At alkaline pH, we again observed two populations but the first one was significantly reduced, indicating the disappearance of casein micelles and the volume percentage was shifted towards the second population as the laser granulometry measures the size of the major particles on the basis of 100% total volume. This second population could always correspond to the fat globules and also to the aggregates constituted of caseins associated with fat globules or caseins themselves. Indeed, the presence of aggregates of caseins was observed in a complementary experiment that was performed with native phosphocaseinate (fat-free purified casein micelles) and we observed a similar result, i.e., appearance of population with a size of about 6 μm (results not shown).
3.2.2. Micellar hydration
At pH 6.7, the amounts of water associated to the casein pellet that was obtained by ultracentrifugation were 2.0 and 2.3 g H2O·g−1 dry pellet for buffalo and cow milks, respectively (Fig. 3). During alkalinisation of both milks, the amount of ultracentrifuged pellet decreased from 12.87% to 0.77% and from 9.10% to 0.55% for buffalo and cow milks, respectively. The water content associated to these pellets increased between pH 6.7 and 8.6. Then, the curves were not plotted for pH 9.7 and 10.8 because the amounts of pellet were considered too low to measure the water contents.
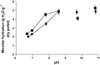 |
Figure 3. Micellar hydration of ultracentrifuged pellets of buffalo (♦) and cow (■) milks as a function of alkalinisation. The curves were not plotted for pH 9.7 and 10.8 because the amounts of pellet were considered as too low. |
3.2.3. Protein contents in supernatants of ultracentrifugation
At pH 6.7, the protein contents in the supernatants of ultracentrifugation of buffalo and cow milks were 11.6 and 9.5 g·kg−1, respectively (Fig. 4). These concentrations corresponded to whey proteins, non-sedimentable caseins, proteose-peptones and small molecules containing nitrogen (free amino acids, urea and peptides). During alkalinisation, an increase in protein contents in the supernatants was determined. At pH 8.6, about 89% and 59% of the total proteins were present in the supernatant of cow and buffalo milks, respectively. At pH 10.8 and 9.7, the totality of the proteins was non-ultracentrifugable for buffalo and cow milks, respectively.
 |
Figure 4. Total protein content (nitrogen × 6.38) in the supernatants of ultracentrifugation of buffalo (♦) and cow (■) milks as a function of alkalinisation. |
3.2.4. RP-HPLC profiles of proteins in milks and supernatants of ultracentrifugation
RP-HPLC analyses of both milks revealed differences regarding their chromatographic profiles. Proteins were grouped into four fractions according to their retention times as κ-CN + αS2-CN, αS1-CN, β-CN and β-Lg (Fig. 5A and B). For both milks, the first fraction was considered as a group of κ-CN and αS2-CN. As shown by Zicarelli [26], these two caseins were more concentrated in buffalo milk than in cow milk. The second fraction (αS1-CN) showed two variants in buffalo milk and one in cow milk. αS1-CN was more concentrated in buffalo milk than in cow milk [16, 26]. The third fraction (β-CN) of cow milk presented two variants corresponding to two well-resolved chromatographic peaks while β-CN of buffalo milk presented only one chromatographic peak with two molecular masses (results not shown). Out of these two masses, one was well identified by the data bank while the other remained unidentified. So we could assume that there might be two variants of the said casein in buffalo milk too but co-eluted. By considering this assumption, our results agreed with the findings of Zicarelli [26] who found two variants of β-CN in both milks. The β-CN and αS1-CN covered up 70% of the chromatographic area of proteins of both milks. The fourth fraction (β-Lg) showed only one variant in the buffalo milk in comparison to its counterpart cow milk that showed two variants (A and B). This result was in agreement with those obtained by Pellegrino et al. [15] who showed that buffalo milk did not contain β-Lg A that was present in cow milk. The α-lactalbumin must be present but was not detected owing to its low concentration in milk. On the other hand, the chromatographic conditions were not optimised to detect this specific whey protein.
 |
Figure 5. RP-HPLC profiles of proteins in control buffalo (A) and cow (B) milks and in the different supernatants of ultracentrifugation obtained from alkalinised milks (C, D: pH 6.7; E, F: pH 9.7 and G, H: pH 10.8 for buffalo and cow milks, respectively). The wavelength for the detection was 214 nm. The quantity of protein injected for milks in A and B was different from those injected for supernatants from C to H. |
In parallel, the same chromatographic analyses were performed on the supernatants of ultracentrifugation of control and alkalinised milks of both species. At pH 6.7, β-Lg was the main protein detected in both milks (Figs. 5C and 5D). At pH 9.7, the majority of casein molecules were in the supernatants of ultracentrifugation of both milks (Figs. 5E and 5F). At pH 10.8, the RP-HPLC profiles of both milks were qualitatively altered with a less good resolution of the chromatographic separation (Figs. 5G and 5H), suggesting biochemical modifications induced by this high pH value.
Calculations of the ratios (HPLC areas of each protein fraction present in the supernatant of alkali added milks to HPLC areas of each protein fraction present in the control milk) showed the increase in casein contents in the supernatants during alkalinisation. For buffalo milk (Fig. 6A), concentrations of the different casein fractions increased gradually and constantly till pH 9.7. For cow milk (Fig. 6B), maximum increase was observed at pH 8.6. No major change in the β-Lg content was observed for both milks as a function of alkalinisation.
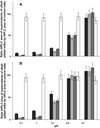 |
Figure 6. Increase in different protein fractions in the supernatants of ultracentrifugation (100 000× g for 1 h at 20 °C) of buffalo (A) and cow (B) milks as a function of alkalinisation. Increase in the contents was calculated as the ratio between HPLC area of each protein fraction present in the supernatants of alkali added milks to HPLC area of each corresponding protein fraction present in the control milk at pH 6.7. The RP-HPLC profiles are shown in Figure 5. Black histograms denote κ-CN + αs2-CN; dark grey histograms denote αs1-CN; light grey histograms denote β-CN and white histograms denote β-Lg. The areas of HPLC profiles obtained at pH 10.8 were not considered as the chromatographic peaks were not well separated. |
3.2.5. Mineral analysis of milks, supernatants of ultracentrifugation and ultrafiltrates
At pH 6.7, the milks contained 65.2 and 33.1 mmol·L−1 of total Ca for buffalo and cow milks, respectively (of which 7.3 and 8.6 mmol·L−1 were found in the aqueous phases of both milks, respectively). Concentrations of 32.7 and 20.8 mmol·L−1 of total Pi were found in buffalo and cow milks, respectively (of which 10.9 mmol·L−1 were found in the aqueous phases of both milks).
In both milks, alkalinisation induced an increase in the concentrations of Ca and Pi in the supernatants of ultracentrifugation (Figs. 7A and 7C) and a decrease in the ultrafiltrates (Figs. 7B and 7D). At pH 10.8, the totality of Ca was nondiffusible while about 1 mmol·L−1 of Pi remained in the ultrafiltrates of both milks. In parallel, the concentration of Na increased in the supernatants of ultracentrifugation and in the ultrafiltrates of both milks (Figs. 8A and 8B).
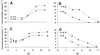 |
Figure 7. Ca (♦) and Pi (▲) concentrations in the supernatants of ultracentrifugation (A and C) and in the ultrafiltrates (B and D) as a function of alkalinisation. A and B correspond to buffalo milk and C and D to cow milks. |
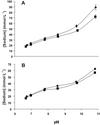 |
Figure 8. Sodium concentrations in the supernatants of ultracentrifugation (A) and in the ultrafiltrates (B) of buffalo (♦) and cow (▲) milks as a function of alkalinisation. |
4. DISCUSSION
Alkalinisation-induced modifications were very similar for both milks, with slight differences depending on the pH values. Buffalo milk showed the maximum modifications at higher pH (about 9.7) than cow milk (about 8.6). This delay in the physico-chemical changes can be related to the concentrations of proteins especially caseins (about 35 and 25 g·kg−1 in cow and buffalo milks, respectively) and minerals especially Ca (65.2 and 33.1 mmol·L−1 in buffalo and cow milks, respectively) and Pi (32.7 and 20.8 mmol·L−1 in buffalo and cow milks, respectively) [1]. The first part of this interpretation concerning the dependence of alkalinisation process on protein contents is supported by the results of Vaia et al. [20] who indicated that the disruption of casein micelles induced by alkalinisation was slower when the concentration of proteins increased.
The physico-chemical changes induced by alkalinisation can be discussed precisely in terms of modifications in minerals equilibria and changes in the state of ionisation of proteins along with other factors.
4.1. Alkalinisation-induced changes in the minerals equilibria and in the state of ionisation of proteins
4.1.1. Changes in the mineral equilibria
At pH 6.7, macro-elements are distributed in aqueous and micellar phases of milk. K, Na and Cl ions are mainly in the aqueous phase while Ca (CaCit−, Ca2+ and CaHPO4), Pi (H2PO4− and HPO42−), citrate and Mg2+ are partly bound to the casein micelles and partly present in the aqueous phase. About two-third of the Ca (four-fifth in buffalo milk), half of the Pi (two-third in buffalo milk), one-third of the Mg and 10% of the citrate are in the micellar phase. In this phase, Ca is present in two forms: micellar calcium phosphate and Ca bound to phosphoseryl residues. All these forms have been shown by the symbol in Figure 9.
 |
Figure 9. Proposed mechanism explaining the changes in the mineral equilibria during alkalinisation. : Ion distribution at pH 6.7. : Modification of Pi ionisation during alkalinisation. : Chelation of different calcium forms by triply ionised Pi. : Formation of new calcium phosphate salts. : Displacement of calcium by sodium (from NaOH). |
During alkalinisation, the distribution of these ions between aqueous and micellar phases was quantitatively modified (step in Fig. 9), showing that the milk system evolved to a thermodynamically more favourable state. Globally, Ca and Pi decreased in the aqueous phase and increased in the supernatants of ultracentrifugation (Fig. 7). During alkalinisation, the state of ionisation of Pi changed from HPO42− towards PO43−. The PO43− form has a greater affinity for Ca (2.88 × 10⁶ M−1) as compared to HPO42− (642 M−1) [25] and this triply ionised form of Pi can be considered as an effective Ca sequestrant (step in Fig. 9). From the results of Van Dijk which indicated that the micellar calcium phosphate was not degraded during alkalinisation [21], it can be suggested that the Ca exclusively interacting with phosphoseryl residues of casein micelles was trapped by the PO43− to form calcium phosphate salt. As the calcium phosphate in the aqueous phase of the milk was saturated and the amounts of Ca and Pi in the aqueous phase decreased during alkalinisation (Figs. 7B and 7D), a precipitation of this salt can be suggested. It is noteworthy that the concentrations of these ions increased in the supernatants of ultracentrifugation (Figs. 7A and 7C), suggesting that the newly formed calcium phosphate had a low weight as it remained nonsedimentable by ultracentrifugation. The analyses of alkalinised milks performed to observe the potential presence of insoluble calcium phosphate salt content using optical and scanning electron microscopes (results not shown) remained unsuccessful, indicating that this calcium phosphate was small enough in size. As regards the location of this calcium phosphate, it may be directly associated with proteins that probably contain nucleation points or may become part of micellar calcium phosphate (step in Fig. 9).
In the interpretation of the changes in the minerals equilibria, it is also necessary to integrate the presence of additional Na due to addition of NaOH (Fig. 8 and step in Fig. 9). The consequences of the addition of Na were probably similar to those described after the addition of NaCl in the literature [4, 5, 13]. It has been shown that addition of NaCl induced mainly exchanges between added Na and Ca bound to casein micelles via the phosphoseryl residues. A similar exchange between Ca and Na may occur after the addition of NaOH. In this case, Ca present in the micellar calcium phosphate remained unaffected and this interpretation is in accordance with the results obtained by other authors [4, 5, 21].
4.1.2. Changes in the state of ionisation of proteins
The state of ionisation of proteins that is also dependent on the pH value can also be discussed to interpret the modifications induced by alkalinisation. By taking into account the pK values of carboxylic groups of the differently charged amino groups (Fig. 10), the glutamic acid, aspartic acid and C-terminal remain completely dissociated because their pKa values are ionised at pH 6.7 and remain in the same state of ionisation during alkalinisation. For this reason, they probably do not contribute to the changes in the proteins. In the opposite, a reduction in the ionisation of the amino-terminus of proteins, ε-amino group of lysine and imidazole group of histidine along with an increase in ionisation of the phenol group of tyrosine and sulphydryl group of cystein is strongly probable. It is also possible that the glycosidic parts of κ-casein may become more ionised (Fig. 9). These ionisation changes cumulatively resulted in an increase in the negative charge of casein molecules. Indeed, we observed between pH 6.7 and 10.8, a significant and similar increase in the negative charge of the caseins from −20 to −24 mV for both milks. This change of charge was also reported and discussed by Vaia et al. [20]. The consequences of these charge changes could have resulted in some modifications in the protein-protein interactions in the casein micelles leading towards disruption.
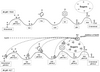 |
Figure 10. Proposed mechanism explaining the changes in the ionisation of proteins between pH 6.7 and 10.8. pK values are reported by Vaia et al. [20]. |
4.2. Disruption of casein micelles with solubilisation of casein molecules, formation of small particles and aggregates and changes in water associated with caseins
At pH 6.7, the majority (90–95%) of the casein molecules are combined to form casein micelles. A variety of molecular forces are involved in the structure and the stability of casein micelles depends on a balance between electrostatic repulsions and hydrophobic interactions. In addition, micellar calcium phosphate crosslinks the casein molecules and neutralises negatively-charged phosphoseryl groups, allowing the formation of hydrophobic interactions between caseins. In milk, the micellar calcium phosphate is in equilibrium with the aqueous phase that is supersaturated with respect to calcium phosphate salts [24, 25].
During alkalinisation, the minerals equilibria and state of ionisation of proteins were modified as previously discussed and induced changes in the molecular organisation of casein micelles. The decrease in whiteness (Fig. 1B) (which is related to particle concentration and structural organisation such as size and contents in protein and minerals) and the increase in viscosity (Fig. 1C) corresponded to a disruption of casein micelles. Increase of nitrogen contents in the supernatant of ultracentrifugation (Fig. 4) confirmed this disruption and identification of caseins in these supernatants by RP-HPLC showed that all casein molecules were solubilised without preference (Figs. 5 and 6). As a consequence of the demineralisation and disruption of casein micelles, the released casein molecules resulted in small particles and self-associated large aggregates (Fig. 2 and results on fat-free native phosphocaseinate not shown).
The modifications in the structural organisation of casein molecules induced changes in the interactions between water and casein molecules and might explain the increase in viscosity determined in this study (Fig. 1C) and were also described by Plomley et al. [18]. These findings were also in agreement with the increase in water content associated with the pellets observed in Figure 3.
5. CONCLUSION
This study demonstrated that alkalinisation of both milks induced changes in minerals, caseins and water distributions between aqueous and micellar phases. These changes were qualitatively similar but some quantitative differences were observed in both milks. The richness of buffalo milk as compared to that of cow milk in caseins (about 35 and 25 g·kg−1 in buffalo and cow milks, respectively), Ca (65.2 and 33.1 mmol·L−1 in buffalo and cow milks, respectively) and Pi (32.7 and 20.8 mmol·L−1 in buffalo and cow milks, respectively) explained why this milk required more alkaline solution to increase the pH. It also explained why buffalo milk showed a delay in modifications as compared to its counterpart cow milk: major and maximum modifications occurred at pH 9.7 and 8.6 in buffalo and cow milks, respectively. These modifications were related to changes in the minerals equilibria and in the state of ionisation of proteins. During alkalinisation, the ionisation state of Pi in the aqueous phase changed by losing one or two protons to be in the form of PO43−. The ability of PO43− to chelate Ca was more pronounced than the H2PO4− and HPO42− forms. In parallel, ionisation of proteins changed during alkalinisation and their negative charge increased. As a result of this chelation of Ca linked to phosphoseryl residues and changes in the protein-protein interactions in the casein micelles, solubilisation of casein molecules took place and a disruption of casein micelles was observed.
Acknowledgments
We thank J. Guillemin from G.I.E. Chataigneraie (Coopérative de Bufflonnes, Zone Artisanale, Maurs, France) for facilitating us with buffalo milk and Higher Education Commission of Pakistan and INRA of France for providing funds to do this research.
References
- Ahmad S., Gaucher I., Rousseau F., Beaucher E., Piot M., Grongnet J.F., Gaucheron F., Effects of acidification on physico-chemical characteristics of buffalo milk: a comparison with cow's milk, Food Chem. 106 (2008) 11–17 [CrossRef].
- Gaucheron F., Le Graët Y., Piot M., Boyaval E., Determination of anions of milk by ion chromatography, Lait 76 (1996) 433–443 [CrossRef].
- Griffin M.C.A., Griffin W.C., A simple turbidimetric method for the determination of the refractive index of large colloidal particles applied to casein micelles, J. Colloidal Interface Sci. 104 (1985) 409–415 [CrossRef].
- Grufferty M.B., Fox P.F., Effect of added NaCl on some physico-chemical properties of milk, Ir. J. Food Sci. Technol. 9 (1985) 1–9.
- Huppertz T., Fox P.F., Effect of NaCl on some physico-chemical properties of concentrated bovine milk, Int. Dairy J. 16 (2006) 1142–1148 [CrossRef].
- Huppertz T., Vaia B., Smiddy M.A., Reformation of casein particles from alkalinedisrupted casein micelles, J. Dairy Res. 75 (2008) 44–47 [PubMed].
- International Dairy Federation, Détermination de la teneur en caséine du lait, International Standard FIL-IDF n° 29, 1964.
- International Dairy Federation, Détermination de la teneur en azote, 4. Détermination de la teneur en azote non protéique, International Standard, FIL-IDF n° 20B, 1993.
- Jaubert A., Martin P., Reverse-phase HPLC
analysis of goat caseins: identification of
 and
and
 genetic variants, Lait 72 (1992)
235–247 [CrossRef].
genetic variants, Lait 72 (1992)
235–247 [CrossRef].
- Karman A.H., Van Boekel M.A.J.S., Evaluation of the Kjeldahl factor for conversion of the nitrogen content of milk and milk products to protein content, Neth. Milk Dairy J. 40 (1986) 315–336.
- Kneifel W., Ulberth F., Schaffer E., Tristimulus colour reflectance measurement of milk and dairy products, Lait 72 (1992) 383–391 [CrossRef].
- Korolczuk J., Maubois J.-L., Loheac J., Suivi de la coagulation-présure du lait à l'aide d'un nouveau capteur réfractométrique, Lait 66 (1986) 327–339 [CrossRef].
- Le Graët Y., Brulé G., Effects of pH and ionic strength on distribution of mineral salts in milk, Lait 73 (1993) 51–60 [CrossRef].
- Odagiri S., Nickerson T.A., Micellar changes in skim milk treated with alkali or acid, J. Dairy Sci. 48 (1965) 1157–1160 [PubMed].
- Pellegrino L., Noni I.D., Tirelli A., Resmini P., Determinazione de latte di vacca nei fromaggi di speceie minori mediante HPLC delle sieroproteine, nota 1, Applicazione alla mozzarella di bufala, Sci. Tec. Latt. Casearia 42 (1991) 87–101.
- Petrilli P., Chianese L., Addeo F., Buffalo
 -casein: isolation and characterization,
J. Dairy Res. 46 (1979) 231–233 [CrossRef] [PubMed].
-casein: isolation and characterization,
J. Dairy Res. 46 (1979) 231–233 [CrossRef] [PubMed].
- Pierre A., Brulé G., Mineral and protein equilibria between the colloidal and soluble phases of milk at low temperature, J. Dairy Res. 48 (1981) 417–428 [CrossRef].
- Plomley K.E., Higgins H.G., Hayes I.F., Spontaneous gelation of alkaline casein dispersions, Nature 167 (1951) 224 [CrossRef] [PubMed].
- Rose D., Relation between micellar and serum casein in bovine milk, J. Dairy Sci. 51 (1968) 1897–1902.
- Vaia B., Smiddy M.A., Kelly A.L., Huppertz T., Solvent-mediated disruption of bovine casein micelles at alkaline pH, J. Agric. Food Chem. 54 (2006) 8288–8293 [CrossRef] [PubMed].
- Van Dijk H.J.M., The properties of casein micelles. 4. The effects of the addition of NaCl, MgCl2 or NaOH on the partition of Ca, Mg and PO4 in cow's milk, Neth. Milk Dairy J. 45 (1991) 241–251.
- Van Dijk H.J.M., The properties of casein micelles. 5. The determination of heatinduced calcium phosphate precipitations in milk, Neth. Milk Dairy J. 46 (1992) 69–76.
- Van Dijk H.J.M., The properties of casein micelles. 6. Behaviour above pH 9, and implication for the micelle model, Neth. Milk Dairy J. 46 (1992) 101–103.
- Walstra P., On the stability of casein micelles, J. Dairy. Sci. 73 (1990) 1965–1979.
- Walstra P., Jenness R., Dairy Chemistry and Physics, John Wiley & Sons, New York, USA, 1984.
- Zicarelli L., Buffalo milk: its properties, dairy yield and mozzarella production, Vet. Res. Comm. 28 (2004) 127–135 [CrossRef].
All Figures
|
Figure 1. pH evolution (A), whiteness (B) and viscosity (C) of buffalo (♦) and cow (■) milks as a function of alkalinisation. |
| In the text | |
|
Figure 2. Size distribution profiles of particles of buffalo (A) and cow (B) milks as a function of alkalinisation. |
| In the text | |
|
Figure 3. Micellar hydration of ultracentrifuged pellets of buffalo (♦) and cow (■) milks as a function of alkalinisation. The curves were not plotted for pH 9.7 and 10.8 because the amounts of pellet were considered as too low. |
| In the text | |
|
Figure 4. Total protein content (nitrogen × 6.38) in the supernatants of ultracentrifugation of buffalo (♦) and cow (■) milks as a function of alkalinisation. |
| In the text | |
|
Figure 5. RP-HPLC profiles of proteins in control buffalo (A) and cow (B) milks and in the different supernatants of ultracentrifugation obtained from alkalinised milks (C, D: pH 6.7; E, F: pH 9.7 and G, H: pH 10.8 for buffalo and cow milks, respectively). The wavelength for the detection was 214 nm. The quantity of protein injected for milks in A and B was different from those injected for supernatants from C to H. |
| In the text | |
|
Figure 6. Increase in different protein fractions in the supernatants of ultracentrifugation (100 000× g for 1 h at 20 °C) of buffalo (A) and cow (B) milks as a function of alkalinisation. Increase in the contents was calculated as the ratio between HPLC area of each protein fraction present in the supernatants of alkali added milks to HPLC area of each corresponding protein fraction present in the control milk at pH 6.7. The RP-HPLC profiles are shown in Figure 5. Black histograms denote κ-CN + αs2-CN; dark grey histograms denote αs1-CN; light grey histograms denote β-CN and white histograms denote β-Lg. The areas of HPLC profiles obtained at pH 10.8 were not considered as the chromatographic peaks were not well separated. |
| In the text | |
|
Figure 7. Ca (♦) and Pi (▲) concentrations in the supernatants of ultracentrifugation (A and C) and in the ultrafiltrates (B and D) as a function of alkalinisation. A and B correspond to buffalo milk and C and D to cow milks. |
| In the text | |
|
Figure 8. Sodium concentrations in the supernatants of ultracentrifugation (A) and in the ultrafiltrates (B) of buffalo (♦) and cow (▲) milks as a function of alkalinisation. |
| In the text | |
|
Figure 9. Proposed mechanism explaining the changes in the mineral equilibria during alkalinisation. : Ion distribution at pH 6.7. : Modification of Pi ionisation during alkalinisation. : Chelation of different calcium forms by triply ionised Pi. : Formation of new calcium phosphate salts. : Displacement of calcium by sodium (from NaOH). |
| In the text | |
|
Figure 10. Proposed mechanism explaining the changes in the ionisation of proteins between pH 6.7 and 10.8. pK values are reported by Vaia et al. [20]. |
| In the text | |