Free Access
Figure 7.
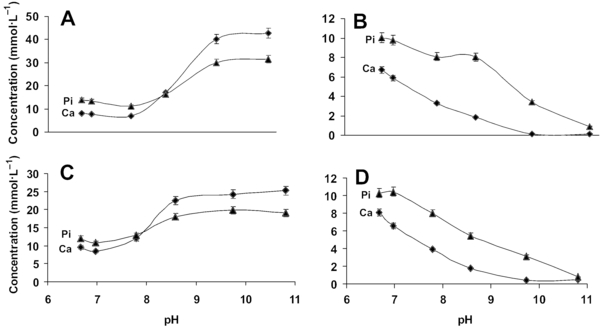
Ca (♦) and Pi (▲) concentrations in the supernatants of ultracentrifugation (A and C) and in the ultrafiltrates (B and D) as a function of alkalinisation. A and B correspond to buffalo milk and C and D to cow milks.