Free Access
Figure 6.
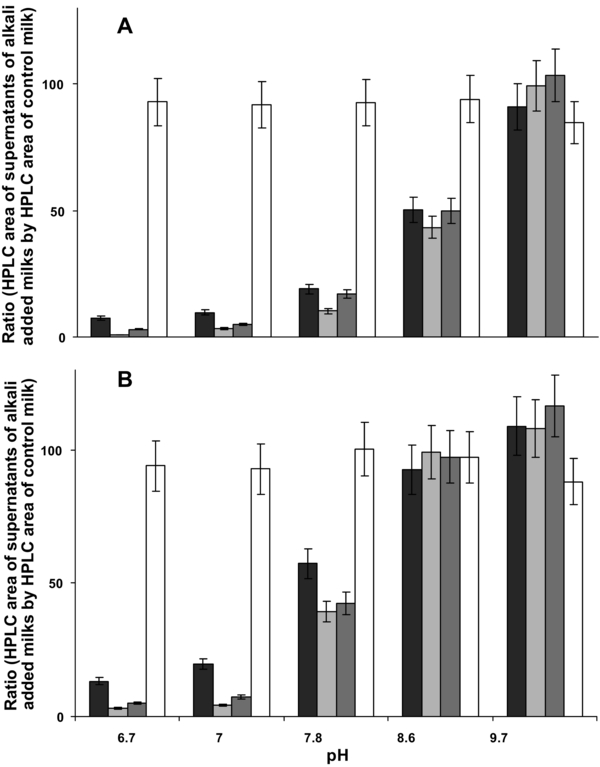
Increase in different protein fractions in the supernatants of ultracentrifugation (100 000× g for 1 h at 20 °C) of buffalo (A) and cow (B) milks as a function of alkalinisation. Increase in the contents was calculated as the ratio between HPLC area of each protein fraction present in the supernatants of alkali added milks to HPLC area of each corresponding protein fraction present in the control milk at pH 6.7. The RP-HPLC profiles are shown in Figure 5. Black histograms denote κ-CN + αs2-CN; dark grey histograms denote αs1-CN; light grey histograms denote β-CN and white histograms denote β-Lg. The areas of HPLC profiles obtained at pH 10.8 were not considered as the chromatographic peaks were not well separated.