| Issue |
Dairy Sci. Technol.
Volume 89, Number 3-4, May-August 2009
1st IDF/INRA International Symposium on Minerals and Dairy Products
|
|
|---|---|---|
| Page(s) | 317 - 333 | |
| DOI | https://doi.org/10.1051/dst/2009009 | |
| Published online | 02 April 2009 | |
Original article
The effect of calcium content of Cheddar-style cheese on the biochemical and rheological properties of processed cheese切达干酪中钙含量对再制干酪生化性质和流变特性的影响
Effet de la teneur en calcium de fromage de type Cheddar sur les propriétés biochimiques et rhéologiques du fromage fondu
Timothy P. Guinee* and Brendan T. O’Kennedy
Moorepark Food Research Centre, Teagasc Moorepark, Fermoy, Co. Cork, Ireland
* Corresponding author (通讯作者): This email address is being protected from spambots. You need JavaScript enabled to view it.
Received: 6 October 2008
Accepted: 5 February 2009
Calcium content of natural cheese has a major impact on its physical properties. The objective of this study was to investigate how the calcium content of natural cheese affects the functionality of processed cheese (PC). The PCs were made from Cheddar cheese with an intact casein content of 89 g·100 g−1 total casein and with calcium/casein ratios (mg·100 g−1) that were low (LCaCC, 19.6), medium (MCaCC, 24.2) or high (HCaCC, 29.8). The PCs were formulated from Cheddar cheese, butter oil, emulsifying salts, preservative and water; the blend was heated to 80 °C while continuously shearing at 2000 rpm for a total time of 4 min. The calcium/casein ratio of the resultant PCs, denoted LCaPC, MCaPC and HCaPC, were 17.86, 22.10 and 28.36 mg·100 g−1, respectively. The PCs were analysed for composition, deformation properties on compression to 30% original sample dimensions, cooking properties (flow on heating at 280 °C for 4 min and 180 °C for 7.5 min) and changes in viscoelasticity on heating from 25 to 80 °C using low-amplitude strain oscillation rheometry. All PCs had similar levels of moisture (~ 47 g·100 g−1), protein (~ 21 g·100 g−1), water-soluble nitrogen, WSN (~ 74 g·100 g−1 total N) and pH 4.6 soluble N (~ 11 g·100 g−1 total N). The fracture stress, fracture strain and firmness of HCaPC were significantly higher than those of MCaPC or LCaPC. The heat-induced flow of HCaPC and MCaPC was significantly lower than that of LCaPC. Heating of PCs from 25 to 88 °C resulted in a continual decrease in storage modulus (G′) of HCaPC and MCaPC; however, G′ for LCaPC decreased to 51 °C but thereafter increased sharply. The phase angle (δ) of all PCs increased to a maximum (δmax) at 45–54 °C and thereafter decreased, the decrease being most pronounced for LCaPC. Reducing the calcium content of the Cheddar cheese significantly increased δmax and reduced the value of G′ at 25 °C, the time to reach δmax and the temperature at δmax of the resultant PC. The results indicate that lower calcium levels in natural cheese give PCs that are softer and shorter (more brittle), that become more fluid and spreadable on heating, that acquire this fluidity in a shorter time and at a lower temperature, but they tend to be less stable on heating at high temperature (~ 80–100 °C) for longer times (> 7 min).
摘要
天然干酪中钙含量可以显著地影响其物理性质。本文研究了天然干酪中钙含量对再制性能的影响。以切达干酪为原料生产的再制干酪,切达干酪的总酪蛋白中完整酪蛋白的含量为 89 g·100 g−1,而 Ca/酪蛋白比(mg·100 g−1) 分别设为低 (LCaCC, 19.6),中 (MCaCC, 24.2) 和高 (HCaCC, 29.8) 三组。 再制干酪的配方为切达干酪、奶油、乳化盐、防腐剂和水,该混合物在 80 °C、2000 rpm下搅拌加热 4 min。根据最终再制干酪的 Ca/酪蛋白比分别表示为低钙再制干酪 (LCaPC,17.86 mg·100 g−1) 、中钙再制干酪 (MCaPC,22.10 mg·100 g−1)和高钙再制干酪 (HCaPC, 28.36 mg·100 g−1) 。测定了所有再制干酪的组成、压缩到原来尺寸 30% 时的变形性、 烹调特性(在 280 °C、4 min 和 180 °C、7.5 min 时的流动性)、以及采用低振幅应变振荡流变仪测定了在 25–80 °C 之间内粘弹性的变化。所有再制干酪样品的水分 (~ 47 g·100 g−1) 、蛋白质 (~ 21 g·100 g−1) 、水溶性氮 (~ 74 g·100 g−1 总氮)及 pH 4.6 可溶性氮 (~ 11 g·100 g−1 总氮) 的含量基本相同。HCaPC 的断裂应力、 断裂应变和硬度显著地高于 MCaPC 和 LCaPC。HCaPC 和 MCaPC 的热流动性显著地低于 LCaPC 。随着加热温度从 25 °C 到88 °C逐渐升高,HCaPC 和 MCaPC 的储能模量 (G′)逐渐减低;然而 LCaPC 则在 25 °C 到 51 °C 范围内随着温度升高储能模量逐渐下降,而 51 °C 后则是随着温度的升高储能模量急剧上升。所有再制干酪样品的相位角 在温度增加到45~54 °C 时达到最大值 δmax,随后则随着温度升高而降低,降低幅度最大的是 LCaPC。切达干酪中钙含量的降低能够显地增加 δmax,降低 25 °C 时的储能模量 (G′)值,减少最终再制干酪达到 δmax 的时间和降低达到 δmax 的温度。试验结果表明天然干酪中钙含量低会导致再制干酪较软和较脆,加热时流动性和涂抹性较好,并且可以在短时间和较低温度下获得这种流动性,但是高温 (~ 80–100 °C) 和长时间 (> 7 min) 的热处理使得这种干酪的稳定性较差。
Résumé
La teneur en calcium du fromage a un impact majeur sur ses propriétés physiques. L’objectif de cette étude était de rechercher combien la teneur en calcium du fromage affecte les propriétés fonctionnelles du fromage fondu. Des fromages fondus (PCs) ont été fabriqués à partir de fromage Cheddar ayant une teneur en caséine intacte de 89 g·100 g−1 de caséine totale et des ratios calcium/caséine (en mg·100 g−1) faible (LcaCC : 19,6), moyen (McaCC : 24,2) ou élevé (HcaCC : 29,8). Les PCs étaient formulés à partir de fromage Cheddar, huile de beurre, sels émulsifiants, conservateur et eau ; le mélange était chauffé à 80 °C sous cisaillement continu à 2000 rpm pendant au total 4 min. Les ratios calcium/caséine des PCs résultants (LCaPC, MCaPC, et HCaPC) étaient respectivement de 17,86 ; 22,10 ; 28,36 mg·100 g−1. Les PCs ont été analysés du point de vue composition, propriétés de déformation au cours d’une compression à 30 % de la dimension initiale de l’échantillon, propriétés de cuisson (écoulement au cours du chauffage à 280 °C - 4 min et 180 °C - 7,5 min), et changements de viscoélasticité au cours du chauffage de 25 à 80 °C en utilisant la rhéométrie par oscillation dynamique de faible amplitude. Tous les PCs avaient des niveaux similaires d’humidité (~ 47 g·100 g−1), protéines (~ 21 g·100 g−1), azote soluble dans l’eau (~ 74 g·100 g−1 d’azote total) et azote soluble à pH 4,6 (~ 11 g·100 g−1 d’azote total). La déformation à la rupture, la contrainte à la rupture et la fermeté des HCaPC étaient significativement plus élevées que celles des MCaPC et LCaPC. L’écoulement induit par le chauffage des HCaPC et MCaPC était significativement plus faible que celui des LCaPC. Le chauffage des fromages fondus de 25 à 80 °C provoquait une diminution continue du module de conservation (G′) des HCaPC et MCaPC. Cependant le G′ des LCaPC diminuait jusqu’à 51 °C mais augmentait brusquement ensuite. L’angle de déphasage, δ, de tous les PCs augmentait à un maximum (δmax) de 45 à 54 °C pour diminuer ensuite, la diminution étant plus prononcée pour LCaPC. Le fait de réduire la teneur en calcium du fromage de Cheddar augmentait significativement le δmax et réduisait la valeur de G′ à 25 °C, le temps pour atteindre δmax et la température à δmax du PC résultant. Les résultats ont indiqué que des niveaux plus faibles de calcium du fromage naturel donnent des PCs qui sont plus mous et plus friables, deviennent plus fluides et tartinables quand on les chauffe, acquièrent cette fluidité en un temps plus court et à une température plus basse, mais tendent à être moins stables quand on les chauffe à température élevée (~ 80–100 °C) sur des durées longues (> 7 min).
Key words: calcium / Cheddar / functionality / processed cheese / rheology
关键字 : 钙 / 切达干酪 / 功能特性 / 再制干酪 / 流变性
Mots clés : calcium / Cheddar / propriété fonctionnelle / fromage fondu / rhéologie
© INRA, EDP Sciences, 2009
1. INTRODUCTION
Cheese is the major ingredient in processed cheese products (PCPs), where it contributes ≥ 51% of the dry matter of the final PCP in the case of processed cheese (PC) foods and spreads, and up to ~ 90% of the dry matter in PC or spreadable PC depending on the blend of the cheeses, the amount of milk fat required to standardise to the minimum fat-in-dry matter content, and the levels of added emulsifying salts and product flavourings [4, 5].
Traditionally, much of the commercial knowledge on PC formulation was proprietary to companies and based on observations and experiences acquired over a long period. Important criteria used in the selection of cheese blends included variety of cheese, its gross composition (fat, protein and moisture contents) and degree of maturity (young, medium and mature); availability and price of cheese; the effects of other materials in the formulation (such as type and level of emulsifying salts) and processing conditions; the experience of formulators in matching the blend of cheeses to the desired end product characteristics; and end product compositional and flavour specifications. As retail PC was considered a secondary grade product compared to natural cheese, PC manufacturing operations had to secure natural cheese for processing at the most cost-effective price, to ensure competitiveness and profitability. Hence, natural cheese of variable quality was frequently used and a strong reliance was placed on in-house expertise to deliver acceptable PCP from this variable raw material. Hence, formulation expertise was essential in “quality-controlling” the texture and flavour of the retail PCPs from a given set of raw materials; a primary example of the application of this expertise is the manufacture of high-moisture PC spreads where regulation of the creaming reaction is essential for influencing the consistency both at filling and in the end product [13].
However, the recent growth in the use of all cheese products, including PCPs, as ingredients in the food service (e.g. in pizza-type dishes, cheese burgers and salad dishes) and industrial sector (cordon bleu entrees, co-extruded products with cheese and gratins) has led to the demand for cheese products more consistent in their rheological and cooking properties. In many of these applications, the cheese is subjected to operations (e.g. heating, shearing and size reduction) that are highly automated and standardised, and consistent performance is essential.
In practice, the demand for more consistent functional properties for PC has led to a greater focus on the effects thereon of the composition and biochemistry of the natural cheese used in its formulation. The effects of many of these parameters, including moisture, pH, intact casein content, have been reported and reviewed [13, 20]. The calcium-to-casein ratio has a major impact on the degree of protein hydration and the physical properties of natural cheese [19, 22, 23, 25]. However, the calcium content is generally not considered in the selection of natural cheese for processing. Yet, its level in natural cheeses exhibits marked inter- (e.g. from ~ 15.2 mg·100 g−1 in Bavarian Blue cheese to 35.6 in Emmental) and intra- (e.g. 26.5 to 30 mg·100 g−1 in Cheddar cheese) [13, 39] variety differences. Kapoor et al. [21] investigated the effect of varying calcium in natural cheese (21–27 mg·g−1 protein) on PC food (15.0–18.5 mg·g−1 protein), formulated using matured Cheddar cheese, non-fat dry milk powder, butter oil and trisodium citrate. They reported that increasing the calcium level increased the firmness and reduced the meltability of the PC food to an extent dependent on the levels of lactose and salt-in-moisture in the Cheddar cheese.
The aim of this study was to evaluate the effect of varying calcium level in the range 487–775 mg·100 g−1 (19.6–29.8 mg·g−1 casein) in Cheddar-style cheese on the composition and rheological properties of the resultant PCs with calcium levels of 17.9–28.6 mg·g−1 casein.
2. MATERIALS AND METHODS
2.1. Manufacture of Cheddar cheeses of varying calcium level
Cheese milk (~ 1500 L) was standardised to a protein-to-fat ratio of 0.96, pasteurised (73 °C for 26 s) and pumped into three cheese vats (~ 450 L) with automated variable speed cutting and stirring (APV Schweiz, AG, CH-3076, Worb 1, Switzerland). Cheddar cheeses with high (HCaCC, control), medium (MCaCC) and low (LCaCC) calcium levels were made by pre-acidification of milk to pH 6.55, 5.8 and 5.6, respectively, prior to rennet addition using a 5 g·100 g−1 lactic acid solution, as described by Sheehan and Guinee [36]. The milk for HCaCC, MCaCC and LCaCC cheeses were adjusted to 31, 29 and 28 °C, respectively, and each was inoculated with rennet (Chymax Plus, Pfizer Inc., Milwaukee, WI, USA) added at a rate of 0.18 mL·L−1, and diluted 1:10 prior to addition.
Following coagulation and cutting, the pH of HCaCC curd from the milk set at pH 6.55 was reduced to 6.15 by adding dilute lactic acid at regular time intervals over a 90-min period. The curd-whey mixture was then pumped into a finishing vat, where the curd was allowed to settle over 3 min; the whey was then drawn off to the top of the curd bed using a positive displacement pump (ITT Jabsco, Hodderson, UK). Glucona-delta-lactone powder (1700 g; Jungbunzlauer SA, Marckolsheim, France) was added to the curd-whey mix over a 30-min period and stirred in manually until the curd pH was reduced to 5.4–5.5, as determined by inserting a pH probe directly into the curd. The curds were then salted (at 2.8 g·100 g−1), moulded and pressed on a horizontal press at 265 kPa overnight.
The manufacture of MCaCC and LCaCC curds was similarly performed, except that the quantities of glucono-delta-lactone added to reduce the pH of the curd to 5.4–5.5 were lower (~ 200 g for LCaCC and 500 g MCaCC).
The cheeses were stored at 12 °C and monitored periodically for level of primary proteolysis using nitrogen solubility at pH 4.6 (pH 4.6-SN). When the level of pH 4.6-SN (as g·100 g−1 total N) of individual cheeses reached ~ 11.0 (~ 21 days), the cheese was cut into cubes (~ 64 cm2) and frozen at −18 °C.
2.2. Manufacture of PC
The formulation used for all processing treatments is given in Table I. Sufficient frozen cheese was thawed at 4 °C for 1 day, shredded (Hallde RG-350 machine, AB Hallde Maskiner, Kista, Sweden) and added (~ 2 kg) to the processed cheese cooker (Stephan UMM/SK5; A. Stephan u. Söhne GmbH & Co., Hameln, Germany). Butter, the dry ingredients (emulsifying salts and potassium sorbate) and water were then added on top of the cheese. The blend was agitated for 1 min, heated to 80 °C using indirect steam injection while continuously shearing at 2400 rpm (usually ~ 1.5–2.0 min) and maintained at this temperature until 4 min had passed. The hot molten mix was filled into a 2 kg mould, placed at 4 °C and held for 2–3 days prior to analysis. Triplicate trials of each treatment were undertaken on separate days.
2.4. Analyses
2.4.1. Compositional analyses of Cheddar cheeses and PCs
The Cheddar cheese used for processing and the PCs were grated and analysed in triplicate for protein, fat, salt, moisture, Ca and P, using standard IDF methods, as described by Guinee et al. [15]; the pH was measured on a cheese slurry prepared from 20 g cheese and 12 mL of de-ionised water [2].
The levels of pH 4.6-soluble cheese nitrogen and water-soluble nitrogen (WSN) were measured as described previously [7, 24]. These were used as indices of the degree of primary proteolysis, and of primary proteolysis plus casein hydration, respectively. A cheese homogenate was prepared by blending grated cheese or PC with water, at a weight ratio of 1:2, using a stomacher (Stomacher®, Lab-Blender 400, Seward Medical Limited, London SE1 1PP, UK) for 5 min. The homogenate was placed in a water bath at 40 °C, centrifuged at 3000× g for 20 min and filtered through glass wool. The resulting filtrate was denoted water-soluble extract (WSE). A portion of the WSE was adjusted to pH 4.6 using 3 N HCl, centrifuged at 3000× g for 20 min, and filtered through glass wool; the resultant filtrate was termed a pH 4.6-soluble extract (pH 4.6-SE). The N contents of the pH 4.6-SE and WSE were determined by the Kjeldahl method (Foss Tecator 2020 Digestor and Autosampler Analyser; Foss, Dublin 12, Ireland).
The calcium and the inorganic phosphorous contents of the WSE were measured by analysis of a filtrate prepared by mixing WSE and 15 g·100 g−1 trichloroacetic acid at a weight ratio of 1–4, and filtering the mixture through Whatman No. 42 filter paper. The phosphorous content was determined using the Spectrometric method [17] and calcium by Atomic Absorption Spectrometric method [18].
The levels of Ca, P and N in the WSE were used as indices of the respective levels of these that were soluble in the moisture phase of PC. The extraction and dilution with water may have influenced the solubility of these components from what they are in the serum phase. However, subjecting the PCs to hydraulic pressing [12] or centrifugation at 12 500× g [16] did not yield cheese serum, which would contain soluble components at their native concentrations.
2.4.2. Functionality of the PCP
2.4.2.1. Rheology of unheated cheese
Cheeses were subjected to compression on a TA-HDi Texture Profile analyser (Stable Micro Systems, Surrey, England) at room temperature. Six samples (25 mm cubes) were prepared from each PC, placed in an airtight plastic bag, held at 4 °C overnight and compressed at a rate of 60 mm·min−1 to 30% of original height. Fracture stress was defined as the force per unit area to induce fracture of the cheese cube and was calculated from the force at the minimum slope of the force-displacement curve. The fracture strain was defined as the fractional displacement at fracture, and firmness was defined as the force required to compress the cheese to 30% of its original height.
2.4.2.2. Cooking properties
Cheese discs (45 mm diameter; 6 mm thick) for flowability test (Method 1) were cut from a cheese slice (~ 8 mm) using a stainless steel ring (diameter, 45 mm; wall thickness, 2 mm; height, 6 mm) sharpened at one end and a sharp blade. The degree of flow/spread on heating a disc of cheese (45 mm diameter, 6.5 mm thick) at 280 °C for 4 min was measured by determining the percentage increase in the diameter of the disc; this method was used to simulate cooking applications where cheese is exposed during oven cooking (pizza, open sandwiches, lasagne and cordon bleu).
Cheese cylinders (~ 15 g; diameter, 22 mm; length, 37.5 mm) were prepared using a polished steel cork borer (no. 16), which was pushed into the cheese to obtain a cheese cylinder that was cut to 15 g using a scalpel blade (Fischer; Shaw Scientific Ltd, Greenhills Industrial Estate, Dublin 12, Ireland). The flowability of the cylinders was measured using Method 2, a modification of the Olson-Price method [30, 33] designed to simulate cooking applications where cheese is not exposed during cooking (e.g. cheese slices in meat burgers and closed sandwiches). The cheese cylinder was placed in a 100-mL graduated glass tube and heated at 180 °C for 7.5 min in a convection oven. Flow was defined as the percentage increase in the length of the cheese.
2.4.2.3. Heat-induced changes in viscoelasticity
Cheese slices (~ 0.4 cm thick) were cut from the PC block using a cheese wire/cutter. Disc samples (40 mm diameter and 2 mm thick) were prepared from the slices using a sharp blade and a stainless steel ring (wall thickness, 2.3 mm; internal diameter, 40 mm; and height, 2 mm), one end of which was sharpened. The leading (sharp) edge of the ring was pushed into the cheese slice and excess cheese was removed with the sharp blade to ensure a uniform flat surface that was flush with the following edge of the ring.
Changes in the viscoelastic properties of cheese, on heating from 20 to 88 °C, were measured by low-amplitude strain oscillation in a controlled stress rheometer (CSL2500 Carri-Med; TA Instruments, Inc., New Castle, DE, USA) as described previously [12]. The cheese discs were placed between two parallel serrated plates (40 mm diameter) of the rheometer cell, tempered at 25 °C for 15 min and subjected to a harmonic low amplitude shear strain (γ) of 0.005 at an angular frequency of 1 Hz. The temperature was then increased to 88 °C over 15 min, during which time the storage modulus (G′) and phase angle (δ) were computed continuously.
2.5. Statistical analysis
Three trials were undertaken; in each, three PCs were manufactured using natural cheeses differing in calcium level (mg·g−1 casein): low calcium (LCaPC, ~ 19.6); medium calcium (MCaPC, ~ 24.2) and high calcium (HCaPC, ~ 29.8). The data were analysed using a randomised complete block design which incorporated the different treatment levels and the three replicate trials. Analysis of variance was carried out using a SAS procedure [34] where the effect of treatment and replicates were estimated for all response variables. Duncan’s multiple-comparison test was used as a guide for pair comparisons of the treatment means. The level of significance was determined at P < 0.05.
The data for some response variables were also analysed by linear regression to establish possible correlations between the response variables (e.g. insoluble Ca and firmness). The significance of correlations was determined by applying Students t test to R2 with n − 2 df where n is the actual number of data points, and df, is the degrees of freedom.
3. RESULTS
3.1. Composition of natural cheeses used for processing
The compositions of the Cheddar cheeses for processing are given in Table II. The moisture content of the cheese increased as the calcium level was reduced. This trend is consistent with the increase in moisture content of Mozzarella cheese as the pH of the milk at set and calcium content of the resultant cheese were reduced [36] and with the inverse relationship between casein-bound calcium and degree of protein hydration in dilute casein dispersions [38]. The differences in moisture content were considered during PC formulation, with less water being added to the PC formulation as the moisture content of the natural cheese increased. We are unaware of any studies reporting an effect on PC of using cheeses with different moisture content in a formulation where the total moisture level is constant; however, assuming a possibly higher degree of protein fusion/aggregation in lower moisture cheeses, it may have some effect on the resultant PCs.
Composition of Cheddar-style cheeses used in the manufacture of pasteurised PC.
3.2. Composition of PCs
The compositions of the PCs are given in Table III. Comparison with Table II shows that there was an ~ 20% dilution of fat, protein and calcium on processing the natural cheese, because of the addition of moisture to PC formulation; in contrast, the level of the phosphorous increased because of the addition of sodium phosphate emulsifying salts.
Composition of experimental PCs made from Cheddar cheeses with different levels of calcium phosphated,e.
The calcium levels (mg·g−1 protein) for LCaPC, MCaPC and HCaPC differed significantly being ~ 18, 22 and 28, respectively; the corresponding phosphorous levels ranged from ~ 29 to 34 mg·g−1 casein. The pH of the PC increased significantly as the calcium and phosphate levels of the natural cheese were reduced. This effect may be attributed to a reduction in the level of insoluble calcium phosphate formed during processing as the calcium and phosphate contents of the Cheddar cheese decreased (Tab. IV). While there were some statistically significant differences in the fat and protein levels between the different PCs, these were numerically small (≤ 6% of the overall mean across the three treatments) and were unlikely to have any impact on functionality.
3.3. Composition of water-soluble and water-insoluble phases of PC
The compositions of the water-soluble phase (WSP) of the PCs, as determined from the analyses of the WSEs, are given in Table IV. Processing of the natural cheeses was accompanied by a large increase in the level of WSN (and hence, protein), from ~ 11 g·100 g−1 total N in the natural cheese to mean values of ~ 70–76 g·100 g−1 total N in the PCs (Tabs. II and III). In contrast, there was little change in the level of pH 4.6-SN from that in the natural cheeses (Tabs. II and III). The calcium level of Cheddar cheese did not significantly affect the mean levels of WSN in the PCs despite the addition of emulsifying salt at a fixed weight to all formulations (rather than pro-rata addition with the calcium-to-casein ratio).
The mean concentration (mg·100 g−1 PC) of calcium in the WSP of HCaPC and MCaPC was significantly higher than that in LCaPC (Tab. IV). However, expressed as a percentage of the total calcium in the PC, the level of calcium in the WSE was highest in the MCaPC and similar in LCaPC and HCaPC. It is noteworthy that the calcium level in the WSP of all PCs was relatively low (≤ 25 g·100 g−1 total) and linear regression analysis indicated the absence of a significant relationship between the concentration of water-soluble Ca and protein.
The inorganic phosphorous concentration (expressed as mg·100 g−1 product) in the WSP of the HCaPC was significantly lower than that of either LCaPC or MCaPC (Tab. IV). The results indicate that most of the added phosphate in the emulsifying salt becomes insoluble as the calcium level in the cheese increases, and suggest the formation of an insoluble complex between the calcium in the cheese and the orthophosphate component of the emulsifying salt.
The composition of the water-insoluble pellets, remaining after centrifugation of the water-cheese homogenate (Tab. IV), was derived from the levels of the individual components in the PC and its WSP. The calcium content of the Cheddar cheese used for processing did not affect the level of water-insoluble protein in the PCs, but significantly influenced the concentrations (mg·100 g−1) of water-insoluble Ca and P, which were highest in HCaPC and lowest in LCaPC. It is notable that while a relatively low fraction of the protein (approximately ≤ 25 g·100 g−1 total) in all PCs was water-insoluble, most of the Ca (≥ 75 g·100 g−1 of total) and P (≥ 65% of total) were water-insoluble.
3.4. Functionality of PCs
3.4.1. Rheological properties of uncooked cheese
The functional properties of the PCs are summarised in Table V. Reducing the calcium level had a marked effect on the rheological properties, as reflected by the significantly lower values of fracture stress, fracture strain and firmness in MCaPC or LCaPC compared to HCaPC.
3.4.2. Properties of the heated cheese
3.4.2.1. Flow
In contrast to the trends noted for rheology of the unheated cheese, the flowability of the heated PC was not influenced by reducing calcium from 28.4 to 22.1 mg·g−1 protein but increased significantly with further reduction in calcium level to 17.9 mg·g−1 protein (Tab. V).
3.4.2.2. Heat-induced changes in viscoelasticity
A typical profile of the changes in viscoelasticity of PCs differing in calcium content on heating from 25 to 88 °C is shown in Figure 1. Heating resulted in a continual decrease in storage modulus, G′, of all PCs except in the case of LCaPC, where following an initial decrease with increasing temperature to 51 °C, it increased sharply on further heating to 82 °C. In contrast, the phase angle (δ) which may be considered an index of the fluidity of the melted cheese mass, increased to a maximum value (δmax) at 45–50 °C and thereafter decreased, with the rate and extent of decrease being most pronounced in LCaPC.
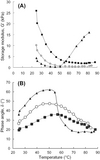 |
Figure 1. Storage modulus (A) and phase angle (B) in PCs with different calcium levels (mg·g−1 protein): LCaPC, 17.9 (▲); MCaPC, 22.1 (○); HCaPC, 28.4 (■). |
Reducing the calcium content of the Cheddar cheese used in processing led to a significant reduction in the value of G′ at 25 °C, an increase in the maximum value of δ, and a decrease in the time required to reach temperature δmax (Fig. 2). This trend is consistent with that noted for flowability (Tab. V), which has been found to be positively correlated with δmax [40]. From a practical viewpoint, the results indicated that the LCaPC became more fluid on heating in a shorter time and at a lower temperature. However, the marked decrease in δ and increase in G′ of LCaPC cheese at temperatures > 55 °C suggests that it had a lower heat stability and congealed more when held at these temperatures for times approximately > 7 min.
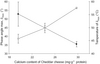 |
Figure 2. Maximum phase angle (δmax) (●) and temperature at δmax (○) of PC as functions of the calcium level in Cheddar cheese. Error bars show the standard deviations of the values from three replicate trials. |
3.5. Relationships between functional properties and compositional characteristics
Data were analysed by linear regression to establish potential relationships between the functionality and the composition of PC, WSEs and water-insoluble cheese pellets (Tab. VI). The results show that functionality was generally highly correlated with the levels of Ca and P, pH of the PC, and with the levels of water-insoluble Ca and P in the pellets obtained on centrifugation of the cheese-water homogenate. In contrast, there was little, or no, correlation between the functional parameters and the levels of water-soluble Ca and P or with the levels of water-insoluble protein.
The pH of PC was negatively correlated with the firmness, fracture stress and fracture strain of the unheated PC, and with the temperature of maximum fluidity (phase angle, δ) on heating. It was positively correlated with flow (as measured using the Olson-Price method) and with the maximum value of δ. In contrast, increasing the levels of total Ca and P (and levels of water-insoluble Ca and P) in the PC resulted in higher values of firmness, fracture stress and fracture strain in the unheated product, and lower values for flowability and fluidity on heating.
4. DISCUSSION AND CONCLUSION
Reducing the levels of calcium (from 29.8 to 19.6 mg·g−1 casein) and phosphorous (from 20 to 16 mg·g−1 casein) in natural cheese had a marked impact on the functionality of the resultant PCs: reductions in fracture stress, fracture strain and firmness of the unheated product, and increases in the extent of flow and fluidity on melting. Considering the relationships between the rheological measurements and sensory texture [6], the current data suggest that the PC became softer and shorter (more brittle) as the calcium level was reduced. The current results concur with those of Kapoor et al. [21] who reported that lowering the calcium level of natural cheese from 26 to 21 mg·g−1 protein led to a 20–45% reduction in hardness and a 10–40% increase in the heat-induced flow of PC food depending on the levels of lactose and salt-in-moisture. However, the change in functionality on reducing the calcium levels in this study was probably also affected by the concomitant increase in the pH (by ~ 0.2 units) of the PC, as reflected by the significant correlations between pH and functional parameters (Tab. VI). Various studies have shown that increasing pH in the range 5.7–6.7 is paralleled by reductions in hardness and storage modulus and an increase in loss tangent [26, 28]. However, it is difficult to gauge the contribution of pH on the functionality of PC because of indirect effects of the methods used to control pH (different emulsifying salts; pH adjustment before formation using a given type of emulsifying salt) on calcium sequestration potential of the emulsifying salt blend during product formation and cooling).
The changes in G′ and δ with temperature in the HCaPC and MCaPC were typical of those reported elsewhere for cheese and PC [10, 12, 27]. They have been attributed to liquefaction of the fat phase [11] and weakening/loosening of the casein network as affected by heat-induced alterations in the balance of hydrophobic attractive forces and electrostatic repulsive forces between the proteins [27]. LCaPC displayed a somewhat unusual behaviour, showing a sharp reduction in δ and large increase in G′ at > 50 °C. This indicated a strong heat-induced thickening in the LCaPC at high temperatures. Such a thickening bears a resemblance to the “creaming effect” exhibited by PCs on holding at high temperature for extended times during manufacture [13]. In practice, this effect, is highly desirable in high-moisture PC spreads where it imparts viscosity, “stand-up” body and creaminess, and is promoted by the use of low-calcium cheeses or the partial replacement of cheese (especially young cheese) or rennet casein with caseinate and/or by the use of specific emulsifying salts such as pyrophosphates known to have high calcium sequestering ability. It is unclear why this occurrence was most pronounced in LCaPC; it may reflect differences in ionic strength in the heated PC mass which would influence the magnitude and range of electrostatic interactions between proteins [1] and, the ratio of attractive-to-repulsive forces. Moreover, the lower level of insoluble calcium phosphate to protein in LCaPC may be conducive to further hydration and swelling of the protein in LCaPC on reheating to high temperatures for a long time (up to 15 min), as pertain to the conditions during measurement of viscoelasticity in this study. The apparent discrepancy between the empirical melt tests (modified Schreiber- and Price-Olson assays) and low deformation theology at temperatures approximately > 50 °C may be attributed to the fact that in the former tests, the samples are not constrained and if flow is initiated at lower temperatures (as for example at < 50 °C in LCaPC), subsequent heating cannot reverse the flow even though the G′ and δ, as measured using low strain deformation at > 50 °C, increase and decrease, respectively; in the latter test, the cheese sample in the form of a high diameter cylinder of low height is constrained between parallel serrated plates during heating.
For all PCs, > 70 g·100 g−1 of the natural cheese protein was in the WSE following processing in the presence of orthophosphates and citrate at pH 6.3–6.5. In addition, it was found that only 18–25 g·100 g−1 of the total calcium and 24–35 g·100 g−1 of the total phosphate were associated with this fraction. Hence, > 75 g·100 g−1 of the total calcium and ~ 70 g·100 g−1 of phosphate was in a water-insoluble state. It is possible that the insoluble calcium and phosphate could be partially associated with the insoluble protein fraction but it is more realistic to expect insoluble calcium phosphate. It is noteworthy that insoluble calcium phosphate inclusions have been frequently observed in PCPs made using sodium orthophosphates and citrates [3, 32, 35], using various microscopic and X-ray diffraction techniques.
These results pose a question, “How does a dominant orthophosphate-based emulsifying salt blend solubilise a large percentage of protein which was inherently insoluble through calcium or calcium phosphate-mediated linkages, in the natural cheese?” Most of the relevant publications on the effects of orthophosphates on casein have reverted to dilute casein dispersions (~ 3–10 g·100 g−1) [29]. Fox et al. [8] showed that high levels of orthophosphate could initiate gelation in reconstituted milk (3–12 g·100 g−1 solids). This gelation phenomenon was pH dependent, being faster at neutral pH values, higher temperatures and higher concentration of milk solids. It is inferred from their data that 80–90 g·100 g−1 of the calcium was associated with the gelled protein fraction which, however, only accounted for 30 g·100 g−1 of protein. This migration of protein from a micellar to a soluble state (milk opacity severely reduced) and the associated migration of calcium (and phosphate?) from what was the casein micelle to a gelled protein matrix is key to the understanding of the phenomenon. Panouillé et al. [31] also observed a heat-induced aggregation and gelation of casein “submicelles” by polyphosphate, which again was pH and concentration dependent. Gaucher et al. [9] studied the effect of high concentrations of orthophosphate (157 mmol·L−1) on skim milk, where the opacity of the milk was severely reduced, a high concentration of soluble casein was produced and calcium phosphate crystals were formed. They suggested that at high levels of added phosphate, both citrate bound calcium (in the serum) and calcium bound to casein (but not to inorganic phosphate) are sequestered by the added phosphate producing precipitated calcium phosphate. This study suggests that similar mechanisms may operate in PC. The depletion of casein calcium and native colloidal calcium phosphate from the casein by the emulsifying salt may result in simultaneous disruption of the casein matrix of the natural cheese and solubilisation of a large portion of the casein. However, extrapolation from a WSE of the PC to mechanisms of emulsifying salt action and resulting functionality of the PC may be just as suspicious as attempting to correlate model studies using gelation of low protein dispersions at high casein-emulsifying salt ratios [9, 31] as the driver of PC functionality. The WSE, as used in this study, may not be entirely simulative of the native serum phase of the PC. Indeed, further studies (Guinee and O’Kennedy, unpublished data) in our laboratory have shown that the levels of water-soluble protein extracted from model PCs made using different levels of disodium orthophosphate anhydrous (0.75–3.4 g·100 g−1) approach 100% of total levels in the cheese, while the levels of soluble calcium increased from 10% to 30% of total Ca, as the ratio of water to PC was increased from 0.5:1 to 10:1 in the preparation of the WSE. A similar observation was made by Shirashoji et al. [37] who reported an increase in soluble Ca from 26% to 63% of total calcium as the extraction ratio of cheese-to-water was increased from 1:1 to 1:4 on using tetra sodium pyrophosphate at 0.25 g·100 g−1 as emulsifying salt.
Regression analysis indicated that the functionality of the PC was strongly correlated with the high levels of water-insoluble calcium and phosphate, but not to the levels of water-soluble/water-insoluble protein. At first approximation this may suggest that (i) insoluble calcium and phosphate largely control the structure, and therefore the rheology and meltability, of the PC possibly by associating with insoluble protein (which only accounted for ~ 25 g·100 g−1 of the protein); (ii) the water-soluble protein has little or no role in the functionality of PCs products; or (iii) insoluble Ca and phosphate form a gel network, which affects product structure and rheology. However, owing to its high concentration (> 30 g·100 g−1 in the moisture phase of PC; Tab. IV), it is likely that the water-soluble protein fraction is a mitigating factor influencing the structure and functionality of PCPs to a degree influenced by the composition of the insoluble phase. In this context, it is noteworthy that LCaPC which had levels of water-soluble/water-insoluble protein very similar to, but levels of water-insoluble Ca and P very different to, those of MCaPC and HCaPC had very different viscoelastic behaviours. Perhaps, a clearer insight on the possible roles of the WSP and water-insoluble phases (WISP) of PC on structure-function relationships could be gleaned from the extensions of model studies, such as those described, which would enable the gelation characteristics of the soluble phase to be studied under various conditions, on its removal from the insoluble phase by centrifugation. However, in addition to its effect on the levels of insoluble calcium and phosphate, varying calcium level in natural cheese may also affect PC properties by other means not considered in this study, for example, degree of emulsification, and differences in moisture content of natural cheese used.
Acknowledgments
The authors gratefully acknowledge the technical assistance of E.O. Mulholland and C. Mullins and the financial assistance of the Dairy Levy Trust.
References
- Bryant C.M., McClements D.J., Molecular basis of protein functionality with special consideration of cold-set gels derived from heat-denatured whey, Trends Food Sci. Technol. 9 (1998) 142–151.
- BSI, Chemical analysis of cheese. Part 5: Determination of pH value, British Standard 770, British Standards Institution, London, UK, 1976.
- Carić M., Kaláb M., Processed cheese products, in: Fox P.F. (Ed.), Cheese, Chemistry, Physics and Microbiology, vol. 2. Major Cheese Groups, Elsevier Applied Science Publishers Ltd., London, UK, 1987, pp. 339–383.
- Code of Federal Regulations, Part 133: Cheese and related products, in: Food and Drugs 21. Code of Federal Regulations, Parts 100–169, US Government Printing Office, Washington, DC (www.gpoaccess.gov/CFR/INDEX.HTML), 2008.
- Codex Alimentarius Commission, FAO/WHO standards Codex [6] Alimentarius, Current Official Standards (www.codexalimentarius.net/web/standard_list), 2008.
- Everard C.D., O'Donnell C.P., O'Callaghan D.J., Howard T.V., Sheehan E.M., Delahunty C.M., Relationships between sensory and rheological measurements of texture in maturing commercial Cheddar cheese over a range of moisture and pH at the point of manufacture, J. Texture Stud. 37 (2006) 361–382 [CrossRef].
- Fenelon M.A., O'Connor P., Guinee T.P., The effect of fat content on the microbiology and proteolysis in Cheddar cheese during ripening, J. Dairy Sci. 83 (2000) 2173–2183 [PubMed].
- Fox K.K., Harper M.K., Holsinger V.H., Pallansch M.J., Gelation of milk solids by orthophosphate, J. Dairy Sci. 48 (1965) 179–185 [PubMed].
- Gaucher I., Piot M., Beaucher E., Gaucheron F., Physico-chemical characterization of phosphate-added skim milk, Int. Dairy J. 17 (2007) 1375–1383 [CrossRef].
- Guggisberg D., Bütikofer U., Albrecht B., Melting and solidification characteristics of Swiss raclette cheese measured by small amplitude oscillatory shear measurements, J. Texture Stud. 38 (2007) 297–323 [CrossRef].
- Guinee T.P., Auty M.A.E., Corcoran M.O., Mulholland E.O., Preliminary observations on effects of fat content and degree of fat emulsification on the structure-functional relationship of Cheddar-type cheese, J. Texture Stud. 31 (2000) 645–663 [CrossRef].
- Guinee T.P., Auty M.A.E., Mullins C., Observations on the microstructure and heat-induced changes in the viscoelasticity of commercial cheeses, Austr. J. Dairy Technol. 1999 (54) 84–89.
- Guinee T.P., Caric M., Kaláb M., Pasteurized processed cheese and substitute products, in: Fox P.F., McSweeney P.L.H., Cogan T.M., Guinee T.P. (Eds.), Cheese, Chemistry, Physics and Microbiology, 3rd edn., vol. 2. Major Cheese Groups, Elsevier Applied Science Publishers Ltd., London, UK, 2004, pp. 349–394.
- Guinee T.P., Harrington D., Corcoran M.O., Mulholland E.O., Mullins C., The compositional and functional properties of commercial Mozzarella, Cheddar and analogue pizza cheeses, Int. J. Dairy Technol. 5 (2000) 51–56 [CrossRef].
- Guinee T.P., Mulholland E.O., Kelly K., O'Callaghan D.J., Effect of protein-to-fat ratio of milk on the composition, manufacturing efficiency and yield of Cheddar cheese, J. Dairy Sci. 90 (2007) 110–123 [PubMed].
- Guo M.R., Kindstedt P.S., Age-related changes in the water phase of Mozzarella cheese, J. Dairy Sci. 78 (1995) 2099–2107.
- IDF, Milk – Determination of total phosphorous content spectrometric method, Provisional International IDF Standard 42B, International Dairy Federation, Brussels, Belgium, 1990.
- ISO/IDF, Milk and milk products – determination of calcium, magnesium, sodium, potassium and magnesium contents – Atomic Absorption spectrometric method, International Standard ISO 8070 and IDF standard 119, International Dairy Federation, Brussels, Belgium, 2007.
- Joshi N.S., Muthukumarappan K., Dave R.I., Effect of calcium on microstructure and meltability of part skim Mozzarella cheese, J. Dairy Sci. 87 (2004) 1975–1985 [PubMed].
- Kapoor R., Metzger L.E., Process cheese: scientific and technological aspects – a review, Compr. Rev. Food Sci. Food Safety 7 (2008) 194–214 [CrossRef].
- Kapoor R., Metzger L.E., Biswas A.C., Muthukumarappan K., Effect of natural cheese characteristics on process cheese properties, J. Dairy Sci. 90 (2007) 1625–1634 [CrossRef] [PubMed].
- Keller B., Olson N.F., Richardson T., Mineral retention and rheological properties of Mozzarella cheese made by direct acidification, J. Dairy Sci. 57 (1974) 174–180.
- Kindstedt P.S., Caric M., Milanovíc S., Pasta-filata cheeses, in: Fox P.F., McSweeney P.L.H., Cogan T.M., Guinee T.P. (Eds.), Cheese, Chemistry, Physics and Microbiology, 3rd edn., vol. 2. Major Cheese Groups, Elsevier Applied Science Publishers Ltd., London, UK, 2004, pp. 251–277.
- Kuchroo C.N., Fox P.F., Soluble nitrogen in Cheddar cheese: comparison of extraction procedures, Milchwissenschaft 37 (1982) 331–335.
- Lawrence R.C., Heap H.A., Gilles J., A controlled approach to cheese technology, J. Dairy Sci. 67 (1984) 1632–1645.
- Lee S.K., Klostermeyer H., The effect of pH on the rheological properties of reduced-fat model processed cheese spreads, Lebensm. Wissens. Technol. 34 (2001) 288–292 [CrossRef].
- Lucey J.A., Johnson M.E., Horne D.J., Invited review: perspectives on the basis of the rheology and texture properties of cheese, J. Dairy Sci. 86 (2003) 2725–2743 [PubMed].
- Marchesseau S., Gastaldi E., Lagaude A., Cuq J.-L., Influence of pH on protein interactions and microstructure of process cheese, J. Dairy Sci. 80 (1997) 1483–1489.
- Mizuno R., Lucey J.A., Properties of milk protein gels formed by phosphates, J. Dairy Sci. 90 (2007) 4524–4531 [CrossRef] [PubMed].
- Olson N.F., Price W.V., A melting test for pasteurized process cheese spreads, J. Dairy Sci. 41 (1958) 999–1000.
- Panouillé M.T., Nicolai T., Durand D., Heatinduced aggregation and gelation of casein submicelles, Int. Dairy J. 14 (2004) 297–303 [CrossRef].
- Rayan A.A., Kaláb M., Ernstrom C.A., Microstructure and rheology of process cheese, Scanning Electron Microsc. 3 (1980) 635–643.
- Rynne N.M., Beresford T.P., Kelly A.L., Guinee T.P., Effect of milk pasteurization temperature and in situ whey protein denaturation on the composition, texture and heat-induced functionality of half-fat Cheddar cheese, Int. Dairy J. 14 (2004) 989–1001 [CrossRef].
- SAS, SAS® User's Guide: Statistics, Version 9.1.3 Service Pack 2, SAS Institute Inc. Cary, NC, USA, 2003.
- Scharf L.G. Jr., Michnick M.J., In situ identification of crystals on process cheese by X-ray diffraction, J. Dairy Sci. 50 (1967) 1989–1991.
- Sheehan J.J., Guinee T.P., Effect of pH and calcium level on the biochemical, textural and functional properties of reduced-fat mozzarella cheese, Int. Dairy J. 14 (2004) 161–172 [CrossRef].
- Shirashoji N., Jaeggi J.J., Lucey J.A., Effect of trisodium citrate concentration and cooking time on the physicochemical properties of pasteurized process cheese, J. Dairy Sci. 89 (2006) 15–28 [PubMed].
- Sood S.M., Gaind D.K., Dewan R.K., Correlation between micelle solvation and calcium content, J. Dairy Sci. Technol. 14 (1979) 32–34.
- USDA, United States Department of Agriculture, Agricultural Research Service, agriculture Handbook No. 8-1, Composition of Foods: Dairy and Egg Products, Raw-Processed-Prepared, US Government Printing Office, Washington, DC, USA, 1976.
- Ustunol Z., Kawachi K., Steffe J., Arnott test correlates with dynamic rheological properties for determining Cheddar cheese meltability, J. Food Sci. 59 (1994) 970–971 [CrossRef].
All Tables
Composition of Cheddar-style cheeses used in the manufacture of pasteurised PC.
Composition of experimental PCs made from Cheddar cheeses with different levels of calcium phosphated,e.
All Figures
|
Figure 1. Storage modulus (A) and phase angle (B) in PCs with different calcium levels (mg·g−1 protein): LCaPC, 17.9 (▲); MCaPC, 22.1 (○); HCaPC, 28.4 (■). |
| In the text | |
|
Figure 2. Maximum phase angle (δmax) (●) and temperature at δmax (○) of PC as functions of the calcium level in Cheddar cheese. Error bars show the standard deviations of the values from three replicate trials. |
| In the text | |