Free Access
Figure 2.
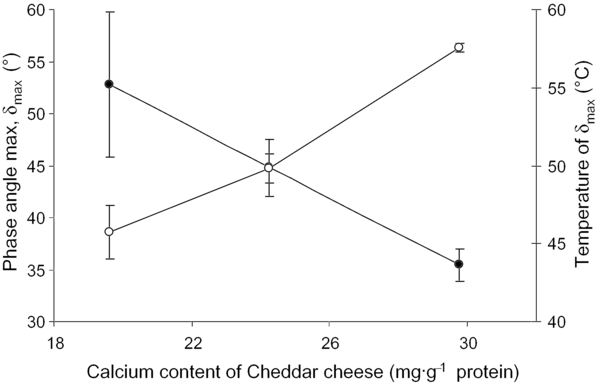
Maximum phase angle (δmax) (●) and temperature at δmax (○) of PC as functions of the calcium level in Cheddar cheese. Error bars show the standard deviations of the values from three replicate trials.
Maximum phase angle (δmax) (●) and temperature at δmax (○) of PC as functions of the calcium level in Cheddar cheese. Error bars show the standard deviations of the values from three replicate trials.