Free Access
Review
Figure 4.
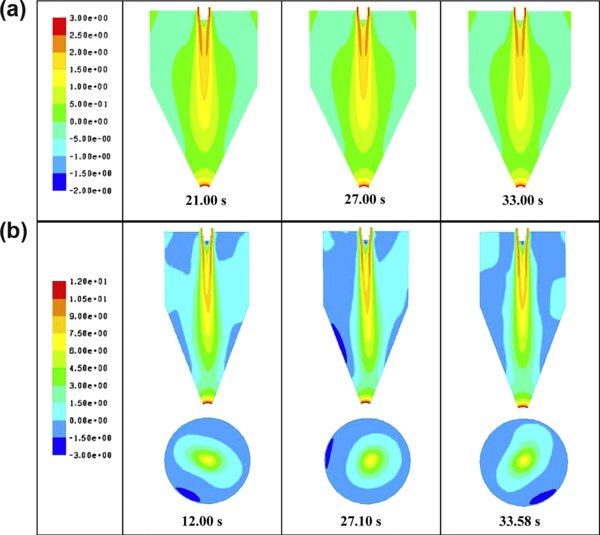
Axial velocity contours at different time intervals for (a) Case A and (b) Case A with smaller radius and higher flow rate (plan view is taken at 0.9 m from the ceiling).