| Issue |
Dairy Sci. Technol.
Volume 90, Number 5, September–October 2010
|
|
|---|---|---|
| Page(s) | 549 - 563 | |
| DOI | https://doi.org/10.1051/dst/2010018 | |
| Published online | 07 April 2010 | |
Original article
Comparison of the digestion of caseins and whey proteins in equine, bovine, caprine and human milks by human gastrointestinal enzymes
马奶、牛奶、山羊奶和人奶中酪蛋白和乳清蛋白在人胃肠道中消化性的比较
Comparaison de la digestion des caséines et des protéines de lactosérum du lait équin, bovin, caprin et humain par les enzymes gastro-intestinales humaines
1
Department of Chemistry, Biotechnology and Food Science, Norwegian University of Life Sciences, Aas, Norway
2
Department of Nutrition, University of Oslo, Blindern, Oslo, Norway
3
Oestfold Hospital Trust, Fredrikstad, Norway
* Corresponding author (通讯作者): This email address is being protected from spambots. You need JavaScript enabled to view it.
Received:
11 May 2009
Revised:
1 February 2010
Accepted:
1 February 2010
Abstract
The aim of this study was to compare the digestion of milk proteins from different species using an in vitro gastrointestinal model. Raw and heated milks from bovine, caprine, human and equine species were digested by human digestive enzymes. Digestion was performed in two 30-min sequential steps by digestive juices from the stomach (pH 2.5/37 °C) and from the duodenum (pH 8.0/37 °C). The degradation patterns of the milk proteins were visualized by SDS-PAGE and quantified using the ImageQuant program. Caseins in the equine milk were rapidly digested by the gastric juice in contrast to the caseins from the other species. During the subsequent digestion by the duodenal juice most of the caseins from all species were degraded within 5 min, and within 30 min only traces of caseins were detected. The mean casein micellar size varied between species in the range of 146.0–311.5 nm (equine > caprine > bovine > human). The α-lactalbumin from all species appeared to be very resistant to both gastric and duodenal digestions. A similar trend was shown for β-lactoglobulin from bovine and caprine milks, of which ~ 60% intact protein remained, while only 25% remained intact in equine milk after total digestion. Equine milk contained a high amount of lysozyme, of which 60% remained intact in the present study. In heated milks from all species, only α-lactalbumin degradation increased approximately 12–20% in comparison to the raw milk. This study shows that equine milk with fast digestible proteins could be considered as a replacement for bovine milk in the diet of people with special needs, such as infants and the elderly.
摘要
本研究体外模拟了人胃肠道酶系对不同来源乳蛋白的消化性。对比了人胃肠道酶系对生鲜和热处理的牛奶、山羊奶、马奶及人奶的消化能力。所有乳样品按照先后顺序分别在胃消化液 (pH 2.5/37 °C) 和十二指肠液 (pH 8.0/37 °C) 中消化 30 min。采用 SDS-PAGE 分析乳蛋白的水解液。在所有乳样中,胃液对马奶的消化速度最快,而在十二指肠液中,5 min 内所有乳源的大多数乳样品基本上被降解,而 30 min 后在肠中只有少量的酪蛋白被检出。各种乳的酪蛋白胶束平均尺寸的变化范围在 146.0 ~ 311.5 nm,是按照马奶>山羊奶>牛奶>人奶的顺序变化。所有乳源的α-乳白蛋白都具有较强的耐胃液和十二指肠液的消化作用。牛奶和山羊奶的β-乳球蛋白也具有较强的耐消化作用,经过胃肠道后 60% 的 β-乳球蛋白被完整地保留下来,但是马奶经过整个消化系统后只有 25% 完整的 β-乳球蛋白。马奶中溶菌酶的含量很高,经过消化系统后 60% 的溶菌酶没有受到破坏。与生鲜乳比较,所有热处理的乳样中,只有α-乳白蛋白的降解率增加了12 ~ 20%。本研究证明了马奶是一种快速消化蛋白,有可能替代牛奶应用在老人和婴儿食品中。
Résumé
Le but de cette étude était de comparer la digestion des protéines laitières provenant de différentes espèces en utilisant un modèle gastro-intestinal in vitro. Des laits crus et traités thermiquement des espèces bovines, caprines, équines et humaines ont été digérés par des enzymes digestives humaines. La digestion a été réalisée au cours de deux étapes séquentielles de 30 min par des sucs digestifs gastriques (pH 2,5/37 °C) et duodénaux (pH 8,0/37 °C). Les profils de dégradation des protéines laitières ont été visualisés par SDS-PAGE et quantifiés à l’aide du programme ImageQuant. Les caséines du lait équin étaient rapidement digérées par le suc gastrique contrairement aux caséines des autres espèces. Au cours de la digestion suivante par le suc duodénal, la plupart des caséines de toutes les espèces étaient dégradées en 5 min, et après 30 min seules des traces des caséines étaient détectées. La taille moyenne des micelles de caséines variait de 146,0 à 311,5 nm selon les espèces (équin > caprin > bovin > humain). L’α-lactalbumine de toutes les espèces apparaissait être très résistante à la fois à la digestion gastrique et duodénale. Une tendance similaire était observée pour la β-lactoglobuline du lait bovin et caprin dont 60 % des protéines restaient intactes, contre seulement 25 % pour le lait équin après digestion totale. Le lait équin contenait une grande quantité de lysozyme dont 60 % demeurait intact dans cette étude. Dans les laits traités thermiquement de toutes les espèces, seule la dégradation de l’α-lactalbumine augmentait de 12 à 20 % environ par rapport au lait cru. Cette étude montre que les laits équins avec leurs protéines rapidement digestibles pourraient être pris en compte comme substitut du lait bovin dans l’alimentation de populations avec des besoins spécifiques, comme les très jeunes enfants et les personnes âgées.
Key words: equine milk / bovine milk / caprine milk / human milk / digestion / whey protein / casein
关键字 : 马奶 / 牛奶 / 山羊奶 / 人奶 / 消化性 / 乳清蛋白 / 酪蛋白
Mots clés : lait de jument / lait de vache / lait de chèvre / lait humain / digestion / protéine de lactosérum / caséine
© INRA, EDP Sciences, 2010
1. INTRODUCTION
The main function of milk proteins is to supply the young neonate with amino acids required for development and growth, and to provide a number of biologically active substances thought to protect the newborn from infections. The composition of milk proteins differs between species and breeds, and also lactation stage, to fulfill the needs for development of the growing mammal [8].
Milk proteins from different species vary in concentration and amino acid composition. The protein content in milk from bovine and caprine species is approximately 2.1–3.5%, whereas equine and human milks contain less protein, approximately 2% and 0.8–1.5%, respectively. Bovine and caprine milks have a high casein to whey ratio of 5.0 and 6.0, whereas equine and human milks have a ratio of 1.5 and 0.9, respectively [11, 21, 24].
The casein fraction consists of αs1-, αs2-, β- and κ-casein. The whey fraction consists of mainly β-lactoglobulin (β-lg), α-lactalbumin (α-la), serum albumin (SA), immunoglobulins, lactoferrin (LF) and lysozyme (LZ) [11]. However, αs2-casein and β-lg are not expressed in human milk [22, 24]. Another notable difference between the milks is their content of the two antimicrobial proteins LF [26] and LZ [10]. Human milk has a high content of LF, whereas equine milk contains high levels of LZ as shown in Table I [21, 24].
Protein content (g·100 g−1) in bovine, caprine, human and equine milks.
Nearly all caseins in milk are organized into colloidal particles referred to as casein micelles [11]. αs1-, αs2- and β-caseins are mainly located in the interior of the micelle and are bound to calcium phosphate nanoclusters by their phosphoserine domains [8, 23]. The proteins are also linked to each other by calcium bridges and hydrophobic interactions [23]. κ-Casein exists mainly on the surface of the micelle with the hydrophilic C-terminal part protruding into the solvent [5, 23]. κ-Caseins are not evenly distributed on the surface, but are present in clusters that are easily accessible for attack by chymosin (and related enzymes).
The size of the casein micelle is inversely related to their κ-casein content [11]. Equine milk has a very low content of κ-casein (0.25 g·L−1), while milks from bovine and caprine species contain 3.5 and 5 g·L−1, respectively. Human milk contains 1.0 g·L−1 κ-casein [24]. It has been suggested that the high content of β-caseins and the variable degree of phosphorylation of equine milk compensate for the low content of κ-casein in the micelle formation [25].
The high digestibility of ~ 95%, combined with a superior amino acid composition for human beings, makes milk protein a “high quality protein” [4]. In addition to the nutritional role, milk proteins have been shown to have different biological effects. In vitro digestion of milk proteins has revealed promising results related to the production of bioactive peptides. Protein digestion starts in the stomach by the action of pepsins, followed by intestinal digestion by trypsin, chymotrypsin and various carboxy- and aminopeptidases. The extent of milk protein degradation in human beings and the transfer of peptides or intact proteins into the serum are not very well understood. Only a limited number of in vivo studies have been performed on the identification of the protein degradation products. Studies with either milk or purified casein and whey proteins in healthy human beings showed that whey proteins were translocated more rapidly to the upper jejunum than the caseins. A large proportion of intact whey proteins were detected in the jejunum, while only traces of intact casein were detected [19, 20]. It was concluded that the caseins were retained as a clot in the acid stomach environment, while the soluble whey proteins were released to the duodenum. This would increase the time before the caseins reach the intestine compared to the soluble whey proteins, and therefore also the time before further degradation and absorption in the intestine. These results led to the concept of “slow” digested caseins and “fast” digested whey proteins [6, 7, 17].
On the contrary, our earlier studies using human gastric (HGJ) and duodenal (HDJ) juices for the in vitro digestion of bovine and caprine milk proteins revealed that the whey proteins, α-la and β-lg, were very resistant to hydrolysis and that the caseins were degraded fast [2]. There are many studies performed on in vitro digestion using commercial enzymes, such as purified pepsin and trypsin, in an attempt to reveal peptides with physiological activities [15, 28]. However, we observed different degradation patterns when comparing human digestive enzymes and commercial enzymes [3].
The aims of the study were:
-
To compare protein degradation of human, bovine, caprine and equine milks by human gastric and duodenal enzymes;
-
To quantify the protein degradation of milks with high content of casein, represented by bovine and caprine versus milks with low content of casein such as human and equine milks;
-
To study possible differences in the protein degradation between raw and heated milks of different species (bovine, caprine, human and equine).
2. MATERIALS AND METHODS
2.1. Milk
The milk samples used were: commercial bovine milk (pasteurized skim milk from TINE BA), commercial equine milk (raw, frozen milk from Equi Libre AS), human milk (raw, a batch from three lactating women) and caprine milk (raw, represented by one individual dairy goat from the University Farm). The protein content of the respective milks measured by the Kjeldahl method was lying within the range of normal values observed by our earlier studies of individual and batch milk [2], and also reported by others (Tab. I).
Fat was removed by heating the milks to 37 °C for 20 min followed by centrifugation at 3000× g for 20 min. Samples were kept at −20 °C for 10–20 min before fat was removed by a spatula, and the defatted samples were stored at −20 °C until further use.
This study also included a high heating step. The same milk samples, as described above, were heated before digestion. The heat treatment of milk was performed at 95 °C for 1 min. After the heat treatment, the milk was cooled and stored at 4 °C for one day before analysis.
2.2. Human digestive enzymes
To follow up and extend previous work on in vitro digestion of milk and milk proteins [1–3, 9], the gastric and duodenal juices employed were obtained from the same person. These juices show enzyme activities that lie within the normal range of pepsin and total proteolytic activities observed in 12 individuals (men and women). The gastrointestinal enzymes were obtained in the activated state by collecting HGJ and HDJ according to Holm et al. [12]. In brief, a three-lumen tube (Maxter Catheters, Marseille, France) enabled both simultaneous instillation of stimulation solution in the duodenum, and aspiration of HGJ and HDJ. The stimulation solution (70 g·L−1 sucrose, 1.8 g·L−1 NaCl, 3.2 g·L−1 L-phenylalanine and 2.3 g·L−1 L-valine in H2O) was instilled close to the papilla of Vater (100 mL·h−1) to stimulate the production of pancreatic enzymes, and HDJ was aspirated some 18 cm distally. Aspirates were collected on ice, centrifuged (4500× g for 10 min) to remove mucous and cell debris before it was frozen in aliquots and stored at −20 °C prior to use.
The pepsin activity of HGJ was measured according to Sanchez-Chiang et al. [29] using hemoglobulin (Hb) as a substrate. The total proteolytic activity of HDJ was measured with casein as a substrate according to Krogdahl and Holm [16]. One unit (U) of enzyme activity is defined as the amount of enzyme solution which gives an absorbance of 1.0 at 280 nm after incubation with substrate at 37 °C for 10 min. All enzyme assays were run in triplicate.
2.3. Assay for in vitro digestion
A two-step in vitro assay was used to simulate human digestion in the stomach (step 1) and the duodenum (step 2). A modified protocol described by Almaas et al. [2] was used. Step 1: 10 mL of milk was acidified by dropwise addition of 2 mol·L−1 HCl to a final pH of 2.5. To get a homogeneous milk sample before adding HGJ, the milk was homogenized by Ultraturrax at medium speed. This process has been compared with the earlier non-homogenized milk sample with no effect on the results. Thirty microliters (1.5 U) of HGJ were added to the milk and then incubated for 30 min at 37 °C with constant magnetic stirring. Step 2: pH was adjusted to 8.0 by 2 mol·L−1 NaOH, 280 μL (3.7 U) HDJ was added and the gastric digested milk sample (8 mL) was incubated for 30 min at 37 °C. Aliquots of 0.25–1.0 mL were withdrawn before digestion, after digestion with gastric enzymes and after 5, 15 and 30 min of the subsequent digestion with duodenal enzymes. To stop the enzymatic reaction, the samples were immediately transferred to ice and frozen (−20 °C). The digestion of each milk sample was run in duplicate or more.
2.4. Sodium dodecyl sulfate-polyacrylamide gel electrophoresis
Sodium dodecyl sulfate-polyacrylamide gel electrophoresis (SDS-PAGE) was used to visualize the protein profile of the samples taken at different hydrolysis times (min) during digestion. Electrophoresis was performed according to standard protocol [18] using homecast 12.5% and 15% acrylamide gels. Gels were stained with Coomassie Brilliant Blue. As a molecular ladder, a low molecular weight standard kit (LMW Calibration Kit, Amersham, GE Healthcare, UK) was used. Samples were diluted 1:2 in 2 X sample buffer and heated at 100 °C for 5 min. To obtain optimal results, different aliquots of sample were applied on the gels; 7 μL of samples of human milk and LMW standard, 3 μL of bovine milk (undiluted and diluted 1:4), 4 μL of caprine milk and 5 μL of equine milk samples. The diluted bovine milk sample was used for quantification of the caseins. More than three SDS gels were run of each milk sample.
2.5. Quantification of protein bands
The protein bands in the gels were quantified by ImageQuant TL 7.0 software (GE Healthcare Bio-Sciences AB, Uppsala, Sweden). Image rectangle was applied for background subtraction, and for detection minimum slope was set to 150. Bands of interest were marked in each lane to be able to investigate the degradation pattern of the different proteins. Area of each band was set as close to the band as possible. In order to measure the degradation, the collective number of undigested proteins was set to 100, and the ratio of each band in the first lane was calculated by normalization. The amount of intact proteins remaining in the digested samples was calculated as percentage of its undigested counterpart. Caseins in all milks were considered as one band because of poor resolution of the individual caseins on SDS-PAGE. Standard curves were obtained with different dilutions and were used to ensure linearity between protein content and the intensity of the bands. The bands quantified were inside the linear area of the respective standard curve.
Two gels from each sample were quantified, and the results are given as an average of mean values.
Statistical analysis of raw milk samples was performed by applying a one-way analysis of variance (ANOVA) on caseins in step 1 (after 30 min) and β-lg in step 2 (after 30 min). The results indicated that differences between species should be detectable. Tests for pairwise differences were only carried out using the least different species, as larger differences would be significant if smaller differences were found to be significant. Equine and bovine were compared for caseins, and equine and caprine were compared for the β-lg. To utilize all eight observations of caseins, we set up a hypothesis and used a t test based on a contrast between the equine and bovine levels of the ANOVA as follows:
 giving a P value of 0.038. For the six observations of β-lg (excluding human), a t value of 3.52 with a corresponding P value of 0.039 was found for the difference between equine and caprine. Both t tests support our claim that equine differs from the other species in the study.
2.6. Casein micelle measurements
Mean size of casein micelles was analyzed by photon correlation spectroscopy (PCS). The measurements were performed using a Zetasizer 3000HS (Malvern Instruments) equipped with a He Ne laser (632.8 nm). The measurements were performed in plastic cuvettes at a scattering angle of 90° at 25 °C. Prior to analysis the milk samples were mixed with 4% glutaraldehyde (GA) in simulated milk ultrafiltrate (SMUF) [13] in the ratio 1:2. The pH of the SMUF was adjusted with 1 mol·L−1 KOH to 6.9 for measurements of equine and human milks, and 6.7 for bovine and caprine milks.
The milk samples mixed with GA were diluted 1:1000 in SMUF, and heated to 25 °C prior to the measurements. To avoid the interference of dust, traces of fat or the former sample, the cuvettes were carefully rinsed in SMUF between each sample, and the diluted samples were filtered through a 0.45 μm filter. All samples were run in triplicate.
3. RESULTS
Milks from different species were digested in vitro by HGJ and HDJ to simulate human digestion. The amount of intact proteins remaining in the digested milk samples visualized by SDS-PAGE is shown in Figure 1. The results revealed that most of the protein degradation occurred after the duodenal digestion. However, it should be noted that the rate of hydrolysis differed among proteins (e.g. caseins versus whey proteins) and between species (bovine β-lg versus equine β-lg) as shown in Figures 1–4.
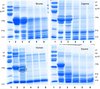 |
Figure 1. Protein profiles of milk from bovine, caprine, human and equine species after digestion in two steps. Step 1: HGJ at pH 2.5 for 30 min/37 °C. Step 2: HDJ at pH 8.0/37 °C for 30 min. 1: Low molecular standard, 2: Undigested milk, 3: HGJ for 30 min, and 4–6: HGJ for 30 min followed by HDJ for 5, 15 and 30 min, respectively. Band within circle is uniquely produced in human milk and seems to be a lower molecular weight fragment of the casein band. α-la = α-lactalbumin, β-lg = β-lactoglobulin, CNs = caseins, HDJ = human duodenal juice, HGJ = human gastric juice, IgHc = immunoglobulin heavy chain, LF = lactoferrin, LZ = lysozyme and SA = serum albumin. |
During gastric digestion (pH 2.5) the caseins in bovine and caprine milks were poorly degraded with a remaining casein content of 69% and 82%, respectively. However, in equine milk the caseins were highly degraded and only 30% remained undigested after 30 min. In human milk the degradation of the main casein band resulted in a protein band of lower molecular size (< 20 kg·mol−1) and about 39% undigested casein was observed. The difference in casein degradation between bovine and equine was significant (P = 0.038). The formation of an extra peptide band, most probably originating from the κ-casein, was clearly seen above the α-la band in bovine and caprine milks (Fig. 1). This band was not possible to detect in milks from human and equine species that may be due to the low content of κ-casein in these milks. Further digestion with human duodenal juice (step 2, pH 8.0) resulted in very fast digestion of the caseins in all the species. After 5 min less than 20% were still intact, and after 30 min almost no caseins were left (< 6%) (Figs. 1 and 2, and Tab. II).
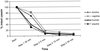 |
Figure 2. In vitro digestion of caseins in raw milks from bovine (♦), caprine (■), human (▲) and equine (●) species by HGJ at pH 2.5/37 °C for 30 min and HDJ at pH 8.0/37 °C for 5, 15 and 30 min. Values are obtained by ImageQuant. Start: Undigested milk, step 1: HGJ pH 2.5/37 °C for 30 min; step 2: HDJ pH 8.0/37 °C for 5, 15 and 30 min. Error bars are omitted for clarity. |
Remaining protein content (%) in raw milks before digestion (start), after step 1 digested with HGJ at pH 2.5 for 30 min/37 °C and after steps 1 and 2 further digested with HDJ at pH 8.0/37 °C for 30 min. Values are obtained by ImageQuant.
The main whey proteins, β-lg and α-lactalbumin, were very resistant to digestion by human gastric and duodenal enzymes. After gastric digestion, β-lactoglobulin, α-la and LZ remained almost intact (> 99%), while LF, SA and immunoglobulins were degraded to some extent (Tab. II).
Human milk is devoid of β-lg; however, this is one of the major whey proteins in milk from the other species. A notable difference was seen during the duodenal digestion as β-lg was significantly (P = 0.039) more hydrolyzed in equine milk as compared to bovine and caprine milks. Only 25% of the equine β-lg was still intact after 30 min, while ~ 60% remained intact in bovine and caprine milks as shown in Figure 3.
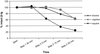 |
Figure 3. In vitro digestion of β-lactoglobulin (β-lg) in raw milks from bovine (♦), caprine (■) and equine (●) species by HGJ at pH 2.5/37 °C for 30 min and HDJ at pH 8.0/37 °C for 5, 15 and 30 min. Values are obtained by ImageQuant. Start: Undigested milk, step 1: HGJ pH 2.5/37 °C for 30 min; step 2: HDJ pH 8.0/37 °C for 5, 15 and 30 min. Error bars are omitted for clarity. |
The most resistant protein to human digestive enzymes in all species was α-la (Fig. 4). Lactoferrin was digested very fast both by gastric and by duodenal juices in all species. Equine milk contained high amount of lysozyme, and interestingly this protein remained mainly intact (65%) after gastric and duodenal digestions.
 |
Figure 4. In vitro digestion of α-lactalbumin (α-la) in raw milks from bovine (♦), caprine (■), human (▲) and equine (●) species by HGJ at pH 2.5/37 °C for 30 min and HDJ at pH 8.0/37 °C for 5, 15 and 30 min. Values are obtained by ImageQuant. Start: Undigested milk, step 1: HGJ pH 2.5/37 °C for 30 min; step 2: HDJ pH 8.0/37 °C for 5, 15 and 30 min. Error bars are omitted for clarity. |
High heat treatment of the milk from all the species resulted in very little differences in the protein degradation, only α-la showed a higher degradation, approximately 10–20%, compared to raw milk (Tab. III).
Remaining protein content (%) of heated milks (95 °C for 1 min) before digestion (start), after step 1 digested with HGJ at pH 2.5/37 °C for 30 min and after steps 1 and 2 further digested with HDJ at pH 8.0/37 °C for 30 min. Values are obtained by ImageQuant.
The mean size of casein micelles in the milks was measured by PCS. Size of the casein micelles varied between the species as seen in Figure 5. Equine milks showed to have the largest micelles (311.5 nm) and human milk the smallest ones (146.0 nm). The micellar sizes of the caprine and bovine milks were 220.4 and 183.9 nm, respectively.
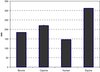 |
Figure 5. Mean size (nm) of casein micelles in raw milk. Bovine: 183.9 ± 0.4 nm, caprine: 220.4 ± 2.8 nm, human: 146.0 ± 0.7 nm, equine: 311.5 ± 1.1 nm. Values are an average of three runs (each containing 10 subruns) obtained by PCS. |
4. DISCUSSION
Gastric digestion and low pH 1.5–2.5 are the first step in the gastrointestinal degradation of proteins in human beings, followed by stomach emptying and further digestion in the upper part of duodenum by pancreatic and brush border enzymes at pH ~7. In this study, we have used an in vitro digestion model employing HGJ and HDJ, containing crude extracts of enzymes, inhibitors, bile salts, etc. This model developed and published earlier [2] for revealing caprine milk protein degradation by SDS and IEF was used. To compare the digestion of raw and heated milk proteins from species other than caprine, like bovine, human and equine species, only SDS gels are shown.
The equine milk behaved differently from the other species by showing a more rapid gastric digestion of the casein already in step 1, leaving only ~ 30% of the caseins intact after 30 min. Also human milk showed a pronounced casein degradation during the gastric digestion; however, the casein of human milk gave rise to a protein band with only a small reduction in the molecular size than the original casein band (Fig. 1, lane 3). The caseins of the other species, caprine and bovine, showed a significantly lower (P = 0.038 between equine and bovine) gastric digestion. Further digestion by the duodenal juice showed that most of the caseins of all species were degraded after 30 min. Also equine β-lg was digested significantly faster (P = 0.039) compared to bovine and caprine β-lg.
Only a limited number of studies in human beings have been performed. Studies with either milk or purified caseins and whey proteins showed that only traces of intact casein could be detected in the jejunum [6, 7, 19, 20]. The authors concluded that this was due to a delayed emptying of casein in the stomach because of the casein clotting under the gastric pH, which delays the delivery to the gut. Milk soluble proteins like whey proteins, on the other hand, were rapidly evacuated from the stomach as intact proteins and further hydrolyzed by pancreatic enzymes in the duodenum. This causes the whey proteins to be absorbed more distally in the intestine [30].
Our in vitro studies showed, however, that the caseins of all studied species were rapidly digested by the gastrointestinal enzymes and that equine milk showed a very high gastric degradation. Equine casein micelles have a very low content of κ-casein and are larger in size (Fig. 5) than the casein micelles in the milks of all the other species. The low content of κ-casein and the large size of the casein micelles may be the reasons for the high susceptibility to hydrolysis by gastric enzymes. Another factor may be that equine milk contains β-caseins with variable degree of phosphorylation. The less phosphorylated forms of β-caseins can act on the surface of the casein micelles and thereby play the role of the κ-casein [25]. Even though a certain amount of the human casein was degraded in the gastric juice, the degradation pattern was very different from the profile observed for the equine caseins. While the human caseins seemed to be broken down to protein fragments of molecular weight just below 20 kg·mol−1, the equine milk caseins were mainly broken down to smaller peptides that were not seen in the gel (Fig. 1).
With respect to the digestion of whey proteins, Mahé et al. [20] reported that after milk ingestion a large proportion of the whey proteins were detected as intact proteins in the human jejunum. Tomé and Debabbi [30] concluded that the soluble whey proteins were emptied much faster from stomach to the intestine. The proteins detected in an intact form (5–10%) in the upper jejunum were β-lg, α-la, LF and immunoglobulins.
Our results confirm that β-lg and α-la were very resistant to human gastric and duodenal enzyme digestions, except for the equine milk showing rapid duodenal degradation of β-lg after 30 min leaving only 25% of the protein intact. In contrast, bovine and caprine β-lg were significantly less digested, and more than 60% of the protein was still intact. However, the other whey proteins such as LF and SA were highly degraded by the human gastrointestinal enzymes.
We also observed that high heating of the milk had only minor effect on the degradation of the caseins. This is most probably due to the fact that the caseins have an open and flexible structure, with peptide bonds easily exposed to the gastrointestinal enzymes. Thereby heating seems not to affect the casein structure as opposed to the globular structure of the whey proteins. Heating resulted in 12–20% higher degradation of α-la compared to raw milk. However, in our study β-lg was not much affected by heating. In a previous study by Kim et al. [14] high degradation of both α-la and β-lg was observed in heat-treated whey protein concentrate digested with commercial enzymes.
5. CONCLUSION
Milk from bovine, caprine, equine and human species showed different degradation patterns when digested with human gastrointestinal enzymes at their respective pH values. Caseins in all species were digested very fast after being exposed to both gastric (pH 2.5) and duodenal juices (pH 8.0). Equine and human caseins behaved differently and were easily degraded even in the gastric juice (pH 2.5). In addition equine β-lg was highly degraded after being treated with the gastrointestinal enzymes, in contrast to the bovine and caprine milks where the β-lg was very resistant. Heat treatment of milk did not seem to affect the protein digestion pattern much, except for increased degradation of α-la in all species. These in vitro experiments are continued in our laboratory and need to be confirmed by in vivo results.
Acknowledgments
We would like to thank Mette Johnson/ Equi Libre, Norway, for providing us with equine milk samples, Hilde Almaas for human milk samples and Maxters Catheters, Marseille, France, for tailoring triple lumen tubes enabling simultaneous instillation of a stimulation solution and aspiration of gastric and duodenal juices in humans.
References
- Almaas H., Berner V., Holm H., Langsrud T., Vegarud G.E., Degradation of whey from caprine milk by human proteolytic enzymes, and the resulting antibacterial effect against Listeria monocytogenes, Small Rum. Res. 79 (2008) 11–15. [CrossRef] [Google Scholar]
- Almaas H., Cases A.-L., Devold T.G., Holm H., Langsrud T., Aabakken L., Ådnøy T., Vegarud G.E., In vitro digestion of bovine and caprine milk by human gastric and duodenal enzymes, Int. Dairy J. 16 (2006) 961–968. [CrossRef] [Google Scholar]
- Almaas H., Holm H., Langsrud T., Flengsrud R., Vegarud G.E., In vitro studies of the digestion of caprine whey proteins by human gastric and duodenal juice and the effects on selected microorganisms, Br. J. Nutr. 96 (2006) 562–569. [PubMed] [Google Scholar]
- Bos C., Mahé S., Gaudichon C., Benamouzig R., Gausserès N., Luengo C., Ferrière F., Rautureau J., Tomé D., Assessment of net postprandial protein utilization of N-15-labelled milk nitrogen in human subjects, Br. J. Nutr. 81 (1999) 221–226. [PubMed] [Google Scholar]
- Dalgleish D.G., Spagnuolo P.A., Douglas Goff H., A possible structure of the casein micelle based on high-resolution field-emission scanning electron microscopy, Int. Dairy J. 14 (2004) 1025–1031. [CrossRef] [Google Scholar]
- Dangin M., Boirie Y., Guillet C., Beaufrère B., Influence of the protein digestion rate on protein turnover in young and elderly subjects, J. Nutr. 132 (2002) 3228S–3233S. [PubMed] [Google Scholar]
- Dangin M., Guillet C., Garcia-Rodenas C., Gachon P., Bouteloup-Demange C., Reiffers-Magnani K., Fauquant J., Ballèvre O., Beaufrère B., The rate of protein digestion affects protein gain differently during aging in humans, J. Physiol. 549 (2003) 635–644. [Google Scholar]
- de Kruif C.G., Holt C., Casein micelle structure, function and interactions, in: Fox P.F., McSweeney P.L.H. (Eds.), Advanced Dairy Chemistry, Vol. 1: Proteins, Kluwer Academic/Plenum Publishers, New York, USA, 2003, pp. 233–276. [Google Scholar]
- Eriksen E.K., Vegarud G.E., Langsrud T., Almaas H., Lea T., Effect of milk proteins and their hydrolysates on in vitro immune responses, Small Rum. Res. 79 (2008) 29–37. [CrossRef] [Google Scholar]
- Exposito I.L., Recio I., Antibacterial activity of peptides and folding variants from milk proteins, Int. Dairy J. 16 (2006) 1294–1305. [CrossRef] [Google Scholar]
- Fox P.F., McSweeney P.L.H., Dairy Chemistry and Biochemistry, Blackie Academic and Professional, London, UK, 1998. [Google Scholar]
- Holm H., Hanssen L.E., Krogdahl A., Florholmen J., High and low inhibitor soybean meals affect human duodenal proteinase activity differently – in vivo comparison with bovine serum-albumin, J. Nutr. 118 (1988) 515–520. [PubMed] [Google Scholar]
- Jenness R., Koops J., Preparation and properties of a salt solution which simulates milk ultrafiltrate, Neth. Milk Dairy J. 16 (1962) 153–164. [Google Scholar]
- Kim S.B., Ki K.S., Khan M.A., Lee W.S., Lee H.J., Ahn B.S., Kim H.S., Peptic and tryptic hydrolysis of native and heated whey protein to reduce its antigenicity, J. Dairy Sci. 90 (2007) 4043–4050. [CrossRef] [PubMed] [Google Scholar]
- Korhonen H., Pihlanto A., Bioactive peptides: production and functionality, Int. Dairy J. 16 (2006) 945–960. [CrossRef] [Google Scholar]
- Krogdahl A., Holm H., Inhibition of human and rat pancreatic proteinases by crude and purified soybean proteinase-inhibitors, J. Nutr. 109 (1979) 551–558. [PubMed] [Google Scholar]
- Lacroix M., Bos C., Léonil J., Airinei G., Luengo C., Dare S., Benamouzig R., Fouillet H., Fauquant J., Tomé D., Gaudichon C., Compared with casein or total milk protein, digestion of milk soluble proteins is too rapid to sustain the anabolic postprandial amino acid requirement, Am. J. Clin. Nutr. 84 (2006) 1070–1079. [PubMed] [Google Scholar]
- Laemmli U.K., Cleavage of structural proteins during assembly of head of bacteriophage-T4, Nature 227 (1970) 680–685. [CrossRef] [PubMed] [Google Scholar]
- Mahé S., Benamouzig R., Gaudichon C., Huneau J.F., Decruz I., Rautureau J., Tomé D., Nitrogen movements in the upper jejunum lumen in humans fed low amounts of casein or beta-lactoglobulin, Gastroenterol. Clin. Biol. 19 (1995) 20–26. [PubMed] [Google Scholar]
- Mahé S., Roos N., Benamouzig R., Davin L., Luengo C., Gagnon L., Gausserges N., Rautureau J., Tomé D., Gastrojejunal kinetics and the digestion of [N-15]beta-lactoglobulin and casein in humans: the influence of the nature and quantity of the protein, Am. J. Clin. Nutr. 63 (1996) 546–552. [PubMed] [Google Scholar]
- Malacarne M., Martuzzi F., Summer A., Mariani P., Protein and fat composition of mare’s milk: some nutritional remarks with reference to human and cow’s milk, Int. Dairy J. 12 (2002) 869–877. [CrossRef] [Google Scholar]
- Martin P., Grosclaude F., Improvement of milk protein-quality by gene technology, Livest. Prod. Sci. 35 (1993) 95–115. [CrossRef] [Google Scholar]
- McMahon D.J., Oommen B.S., Supramolecular structure of the casein micelle, J. Dairy Sci. 91 (2008) 1709–1721. [CrossRef] [PubMed] [Google Scholar]
- Miranda G., Mahé M.-F., Leroux C., Martin P., Proteomic tools to characterize the protein fraction of Equidae milk, Proteomics 4 (2004) 2496–2510. [CrossRef] [PubMed] [Google Scholar]
- Ochirkhuyag B., Chobert J.M., Dalgalarrondo M., Haertlé T., Characterization of mare caseins. Identification of αs1- and αs2-caseins, Lait 80 (2000) 223–235. [CrossRef] [EDP Sciences] [Google Scholar]
- Orsi N., The antimicrobial activity of lactoferrin: current status and perspectives, Biometals 17 (2004) 189–196. [CrossRef] [PubMed] [Google Scholar]
- Park Y.W., Goat milk – chemistry and nutrition, in: Park Y.W., Haenlein G.F.W. (Eds.), Handbook of Milk of Non-Bovine Mammals, Blackwell Publishing, Oxford, UK, 2006, pp. 34–58. [Google Scholar]
- Salami M., Yousefi R., Ehsani M.R., Dalgalarrondo M., Chobert J.-M., Haertlé T., Razavi S.H., Saboury A.A., Niasari-Naslaji A., Moosavi-Movahedi A.A., Kinetic characterization of hydrolysis of camel and bovine milk proteins by pancreatic enzymes, Int. Dairy J. 18 (2008) 1097–1102. [CrossRef] [Google Scholar]
- Sanchez-Chiang L., Cisternas E., Ponce O., Partial-purification of pepsins from adult and juvenile salmon fish Oncorhynchus keta. Effect of NaCl on proteolytic activities, Comp. Biochem. Physiol. B 87 (1987) 793–797. [CrossRef] [PubMed] [Google Scholar]
- Tomé D., Debabbi H., Physiological effects of milk protein components, Int. Dairy J. 8 (1998) 383–392. [CrossRef] [Google Scholar]
All Tables
Remaining protein content (%) in raw milks before digestion (start), after step 1 digested with HGJ at pH 2.5 for 30 min/37 °C and after steps 1 and 2 further digested with HDJ at pH 8.0/37 °C for 30 min. Values are obtained by ImageQuant.
Remaining protein content (%) of heated milks (95 °C for 1 min) before digestion (start), after step 1 digested with HGJ at pH 2.5/37 °C for 30 min and after steps 1 and 2 further digested with HDJ at pH 8.0/37 °C for 30 min. Values are obtained by ImageQuant.
All Figures
|
Figure 1. Protein profiles of milk from bovine, caprine, human and equine species after digestion in two steps. Step 1: HGJ at pH 2.5 for 30 min/37 °C. Step 2: HDJ at pH 8.0/37 °C for 30 min. 1: Low molecular standard, 2: Undigested milk, 3: HGJ for 30 min, and 4–6: HGJ for 30 min followed by HDJ for 5, 15 and 30 min, respectively. Band within circle is uniquely produced in human milk and seems to be a lower molecular weight fragment of the casein band. α-la = α-lactalbumin, β-lg = β-lactoglobulin, CNs = caseins, HDJ = human duodenal juice, HGJ = human gastric juice, IgHc = immunoglobulin heavy chain, LF = lactoferrin, LZ = lysozyme and SA = serum albumin. |
| In the text | |
|
Figure 2. In vitro digestion of caseins in raw milks from bovine (♦), caprine (■), human (▲) and equine (●) species by HGJ at pH 2.5/37 °C for 30 min and HDJ at pH 8.0/37 °C for 5, 15 and 30 min. Values are obtained by ImageQuant. Start: Undigested milk, step 1: HGJ pH 2.5/37 °C for 30 min; step 2: HDJ pH 8.0/37 °C for 5, 15 and 30 min. Error bars are omitted for clarity. |
| In the text | |
|
Figure 3. In vitro digestion of β-lactoglobulin (β-lg) in raw milks from bovine (♦), caprine (■) and equine (●) species by HGJ at pH 2.5/37 °C for 30 min and HDJ at pH 8.0/37 °C for 5, 15 and 30 min. Values are obtained by ImageQuant. Start: Undigested milk, step 1: HGJ pH 2.5/37 °C for 30 min; step 2: HDJ pH 8.0/37 °C for 5, 15 and 30 min. Error bars are omitted for clarity. |
| In the text | |
|
Figure 4. In vitro digestion of α-lactalbumin (α-la) in raw milks from bovine (♦), caprine (■), human (▲) and equine (●) species by HGJ at pH 2.5/37 °C for 30 min and HDJ at pH 8.0/37 °C for 5, 15 and 30 min. Values are obtained by ImageQuant. Start: Undigested milk, step 1: HGJ pH 2.5/37 °C for 30 min; step 2: HDJ pH 8.0/37 °C for 5, 15 and 30 min. Error bars are omitted for clarity. |
| In the text | |
|
Figure 5. Mean size (nm) of casein micelles in raw milk. Bovine: 183.9 ± 0.4 nm, caprine: 220.4 ± 2.8 nm, human: 146.0 ± 0.7 nm, equine: 311.5 ± 1.1 nm. Values are an average of three runs (each containing 10 subruns) obtained by PCS. |
| In the text | |