| Issue |
Dairy Sci. Technol.
Volume 89, Number 3-4, May-August 2009
1st IDF/INRA International Symposium on Minerals and Dairy Products
|
|
|---|---|---|
| Page(s) | 349 - 362 | |
| DOI | https://doi.org/10.1051/dst/2009015 | |
| Published online | 20 May 2009 | |
Original article
Kinetics of Maillard reactions in model infant formula during UHT treatment using a static batch ohmic heater静态间歇式欧姆加热超高温(UHT)热处理婴儿配方奶粉的美拉德反应动力学
Cinétique des réactions de Maillard dans une formule infantile modèle au cours d’un traitement UHT dans un réacteur discontinu statique à chauffage ohmique
Stéphanie Roux1, Mathilde Courel2, Lamia Ait-Ameur3, Inès Birlouez-Aragon3 and Jean-Pierre Pain1*
1 Université Montpellier II, UMR Qualisud, Place Eugène Bataillon, 34095 Montpellier cedex 5, France
2 AgroParisTech, INRA, UMR 1145 Ingénierie Procédés Aliments, 1 avenue des Olympiades, 91300 Massy, France
3 AgroParisTech, Département SPAB, 16 rue Claude Bernard, 75231 Paris cedex 5, France
* Corresponding author (通讯作者): This email address is being protected from spambots. You need JavaScript enabled to view it.
Received: 30 September 2008
Accepted: 26 March 2009
The impact of an ultrahigh temperature (UHT) treatment on a model infant formula (IF) was examined by assessing the advancement of Maillard reactions during a thermal treatment by ohmic heating. The heating and holding steps of the heat treatment were carried out in a static batch ohmic heater equipped with a nitrogen counter-pressure system, allowing the reaching of five temperature levels from 100 to 140 °C. A heat treatment was characterised by monitoring a holding time at a given temperature. Samples were taken during heating and holding steps and analysed for early Maillard reaction products (MRPs), such as furosine, advanced MRPs, such as advanced glycated end products (AGEs) and carboxymethyllysine (CML), and final MRPs such as melanoidins. The results show that Maillard reactions in model IF are highly dependent from time-temperature treatment. In compliance with other classical heating techniques, the selected chemical markers followed a pseudo-zero order of reaction under isothermal conditions. However, the contribution of the heating step can be significant as MRPs could be detected from the first seconds of the UHT treatment.
摘要
通过美拉德反应程度来评价(UHT)处理对婴儿配方粉模型的影响,加热和恒温过程是在带有氮气反压系统的静态间歇式欧姆加热器中完成的,温度可以控制在 100–140 °C五个水平。通过检测在给定温度下的恒温时间来评定热处理过程。在加热和恒温过程中取样分析其美拉德早期反应产物糠氨酸,近一步的美拉德反应产物晚期糖基化终末产物 (AGE) 和羧甲基赖氨酸 (CML),以及最后的美拉德反应产物蛋白黑素。结果表明在婴儿配方奶粉中的美拉德反应程度受时间和温度的影响十分显著。与其他经典加热技术一样,在等温条件下,所选择的化学标记物遵循假零级反应。然而,通过对UHT处理最初阶段产物的检测可以确定加热过程对美拉德反应产物形成的影响较大。
Résumé
L’impact d’un traitement UHT sur une formule infantile modèle a été évalué en mesurant le degré d’avancement de la réaction de Maillard pendant un traitement thermique par chauffage ohmique. Les étapes de chauffage et chambrage ont été effectuées dans un réacteur ohmique discontinu statique équipé d’un dispositif de contre-pression d’azote qui a permis d’atteindre cinq niveaux de température de 100 à 140 °C. Chaque traitement thermique a été caractérisé par un couple temps de chambrage/température. Des échantillons prélevés pendant les étapes de chauffage et de chambrage ont été analysés pour quantifier des produits précoces de la réaction de Maillard comme la furosine, des produits avancés comme les produits avancés glycatés ou la carboxyméthyllysine et des produits terminaux comme les mélanoïdines. Les résultats montrent que les réactions de Maillard dans une formule infantile modèle sont très dépendantes du barème temps/température appliqué. En accord avec les résultats publiés par d’autres auteurs sur des méthodes classiques de traitement thermique, les marqueurs de Maillard sélectionnés suivent une réaction d’ordre pseudo-zéro en conditions isothermes. Cependant, dans un procédé UHT, la contribution de l’étape de chauffage ne peut être négligée puisque les produits de la réaction de Maillard peuvent être détectés dès les premières secondes du traitement thermique.
Key words: Joule effect / infant dairy product / thermal treatment / Maillard reaction
关键字 : 焦耳效应 / 婴儿奶制品 / 热处理 / 美拉德反应
Mots clés : effet Joule / produit lacté infantile / traitement thermique / réaction de Maillard
© INRA, EDP Sciences, 2009
1. INTRODUCTION
Infant formulas (IFs) are dairy-based products carefully designed to complete all nutritional needs of non-breastfed newborns. In order to ensure the microbiological security and to extend the shelf life, IFs are submitted to a succession of thermal treatments like pasteurisation, heat-sterilisation, concentration or spray-drying. The ultrahigh temperature (UHT) sterilisation (130–140 °C, 3–6 s) which in some cases can be followed by in-bottle sterilisation (110 °C, 10 min) or spray-drying, leads to major changes in the initial composition of the IF [9]. The main degradation reactions causing nutritional damages to the products are linked to protein glycation during Maillard reaction [32].
Maillard reaction is a very complex chemical reaction between an amine group and a carbonyl group. It can be decomposed into three stages (Fig. 1). Firstly, in the early steps of the Maillard reaction, a reducing sugar – lactose in IF – condenses with an amine base – lysine in IF – to form Amadori products – mainly lactulosyllysine in IF. Lactulosyllysine can be measured after conversion into furosine, which is the result of its acid hydrolysis. Secondly, Amadori products turn into advanced glycated end products (AGEs). Some of these AGEs are fluorescent and the reaction can be studied by a global approach using the FAST method (Fluorescence of Advanced Maillard Products (Famp) and Soluble Tryptophan). This method is based on the exploitation of two fluorescence signals: (i) fluorescence of tryptophan (Ftrp), which can be correlated to protein content and, therefore, to protein thermal denaturation [8]; (ii) Famp, which is a global signal produced by numerous unidentified Maillard compounds. Unfortunately, Famp cannot be calibrated with any standard solution. Nevertheless, the FAST index given by the ratio Ftrp/Famp was reported to be well correlated to the advancement of Maillard reaction [6, 10]. The fluorescence property can also be used to follow end compounds like carboxymethyllysine (CML) by frontal fluorescence [7, 18]. Carboxymethyllysine is an interesting AGE because it is a terminal product that accumulates during the reaction. Thirdly, during the final steps of Maillard reaction, some AGEs can polymerise to form melanoidins, brown nitrogenous compounds, which are easily monitored by colorimetry. In most cases, the industrial sterilisation thermal treatments are designed to avoid reaching the colouring step although it is likely to develop during storage [11, 18]. All along the reaction, the lysine, which is an essential amino acid, is degraded to produce undesirable neoformed compounds. As a matter of fact, AGEs are suspected to be implied in the development of atherosclerosis, diabetes, aging and chronic renal failure [20, 21].
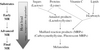 |
Figure 1. Simplified diagram of Maillard reaction in IF. |
The composition of IFs needs to be scrupulously adapted to the nutritional needs of the newborns. Their formulation is, therefore, designed to be as close as possible to mother’s milk. Depending on the type of ingredient used, the formulas can be more or less reactive. The type of protein is important: casein seems to be less reactive than whey protein [9, 30]. Some IFs are based on hydrolysed proteins to reduce allergenicity, but it was shown that protein hydrolysis activates the Maillard reaction [5]. The type of sugar is also important. Simple sugars, particularly glucose, seem to be more reactive than complex sugars like lactose [25, 30]. Experiments on simplified models have also shown that reaction pathways are different when using mono or disaccharides [12, 13]. Furthermore, IFs contain lipids including a great quantity of polyunsaturated fatty acids, which can also play a major role in Maillard reaction [26, 27]. All these reactions are strongly enhanced by the presence of minerals and vitamins. Iron and ascorbic acid are added in order to prevent newborns from iron and vitamin deficiency but they increase the hydroxyl radical formation [1], the lysine glycation and the tryptophan oxidation [22].
The heating technique chosen for this study was ohmic heating, the principle of which relies on Ohm’s law: the circulation of an electric current through a resistant food matrix produces heat, proportionally to the electric field and to the food’s electrical conductivity, thus allowing the heating of the product in its whole volume [16, 28]. Unfortunately, fouling problems cannot be avoided in industrial continuous installations, since velocity gradients near the walls induce thermal gradients in the product. This problem was reported to make the ohmic technology inappropriate for the industrial treatment of dairy products [3]. However, using a batch configuration at laboratory scale allows limiting thermal gradients inside the product. In addition, as soon as electricity is stopped, no more energy is transmitted to the product, making this technique very reactive and attractive for kinetic studies. A lot of work has been dedicated to study a potential additional effect of electricity on thermal destruction of microorganisms and enzymes. One of these studies shows an additional electrical destruction of an Escherichia coli population in goat milk [29]. Despite interesting perspectives of thermal treatment reduction, this electrical contribution was not considered in this work and ohmic heating was merely used as a convenient method to situate the Maillard reaction in the UHT domain.
A considerable volume of work, dedicated to increasing the knowledge on the chemistry of the Maillard reaction, deals with simple model solutions heated at laboratory scale under 100 °C with poorly characterised temperature conditions. Unfortunately, the results of these studies are very difficult to extrapolate to real complex food products thermally treated under industrial conditions. The objective of this work was to study the thermal degradations occurring in a complex food solution modelling liquid IFs, during a fast thermal treatment at temperatures above 100 °C imitating a UHT treatment. Two types of degradations were focussed on: protein denaturation and Maillard reaction. Five indicators of the heat treatment were monitored: Ftrp accounting for protein denaturation, FAST index, furosine, CML and colour representing the advancement of Maillard reaction. The perspective of such a study is to provide knowledge and tools to control the apparition of undesirable newly formed compounds – respectively to limit the loss of desirable ones – in industrial processes and to propose alternative technologies for a global improvement of the quality of IF.
2. MATERIALS AND METHODS
2.1. Materials
2.1.1. Model IF
A model IF was developed within the framework of ICARE European Project. It is based on microfiltered milk supplemented with different constituents to be as close as possible to mother’s milk (Tab. I). Its electrical conductivity is of 0.27 S·m−1 at 20 °C, allowing good performances with ohmic heating. This product is very sensitive and must be stored at 4 °C for a maximum of 10 days. It is a complex emulsion, which is difficult to reproduce exactly at laboratory scale. Therefore, the model formula used in this study was issued from one batch produced by an industrial ICARE partner.
Composition of the model IF; the main reaction substrates or catalysers are detailed in italics.
2.1.2. Ohmic heating equipment
Ohmic treatments were performed in a laboratory-scale static reactor of 100 mL capacity, specifically designed for this study (Fig. 2). Electrodes are made of titanium covered by a specific alloy to avoid electrolysis. Fitted with an original design of monitoring equipment (simulator control and data acquisition), it is possible to reproduce thermal treatments successively comprising heating, holding and cooling stages. Heating is obtained from a 5 kW power supply delivering a 50 Hz alternative current and generating a steady electric field from 0.1 to 3 kV·m−1. During holding, isothermal conditions are obtained by an ohmic heating supply allowing the balancing of the heat loss due to natural convection at the walls of the reactor. Holding temperature levels range from ambient to 150 °C, thanks to a counter-pressure system based on nitrogen pressurised housing preventing from ebullition and oxidation of product. A taking-away system allows successive sampling of five volumes of 15 mL each, per batch during heating or holding. The extracted samples are rapidly cooled (T < 100 °C in 1 s and T < 20 °C in 3 min) in an ice bath from bulk temperature to 20 °C. Bulk temperature is continuously monitored by a type K (NiCr/NiAl) thermocouple (diameter 1.5 mm and temperature ± 1.5 °C) positioned at the bottom of the cell. The process control system enables accurate management of processing conditions (temperature vs. time) and online data collection (voltage ± 0.25% and current intensity ± 0.5%, temperatures). The reproducibility of a temperature profile obtained for five holding temperatures (100, 110, 120, 130 and 140 °C) was assessed and the variation coefficient of the mean holding temperature achieved did not exceed 1.5%.
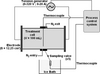 |
Figure 2. Simplified scheme of the thermal treatment installation. |
2.2. Analytical methods
2.2.1. FAST method
The FAST method used in this study was described by Birlouez-Aragon et al. [10]. One millilitre of sample was made up to 50 mL with sodium acetate buffer (0.1 mol·L−1, pH 4.6) to precipitate the insoluble proteins. Four millilitres of supernatant were then filtered through a 0.45 μm nylon filter (VWR, Fontenay-sous-Bois, France) and placed in a disposable four-faced acryl cuve (Sarstedt, Marnay, France). The Ftrp was measured with a spectrofluorimeter (Cary Eclipse Varian, Courtabœuf, France) at excitation/emission wavelengths of 290/340 nm and Famp at 330/420 nm. The Ftrp signal was calibrated with soluble protein (Prolacta 90 from Lactalis, Laval, France) solutions from 0.2 to 20 g·L−1 with the following equation: Ftrp = 223.75*[soluble proteins] (g·L−1) – 42.983. Confidence limits are: Ftrp(−) = 222.86*[soluble proteins] (g·L−1) – 48.643 and Ftrp(+) = 224.63*[soluble proteins] (g·L−1) – 37.323. The FAST index is given by the ratio Famp/Ftrp*100. Maximum variation coefficients of 3.5% were obtained for Ftrp and FAST index.
2.2.2. Furosine and CML analysis
Furosine and CML were simultaneously analysed by GC-MS-MS (Thermo Electron Corporation, Waltham, USA), from frozen samples. The method used was inspired from Charissou et al. [14]. It consisted in defatting the samples with ethanol and dichloromethane before centrifugation. A proteinic ring was formed, transferred to another tube and hydrolysed with concentrated HCl. An internal standard was added to part of the hydrolysed sample. The mix was dried under vacuum, further dissolved in using water, filtered (nylon, 0.22 μm) and dried again. Then, the derivatisation step included an esterification of the carboxylic functions (methanol under strongly acidic conditions) and an acylation of the amine functions (trifluoroacetic acid anhydre). Finally, CML and furosine were quantified by selected ion monitoring on a gas chromatograph coupled with tandem mass spectrometry. The CML and furosine analyses were made in triplicate. Protein quantification by the rapid fluorescamine method [33] was done to express results per gram of proteins. 20 μL of filtered hydrolysate was made up to 3 mL by borate buffer (0.2 mol·L−1; pH 8.5) and mixed with 100 μL of fluorescamine (0.15 g·L−1 of acetone). The fluorescence was measured at excitation/emission wavelengths of 390/475 nm on a spectrofluorimeter (Fluoromax-Spex, Jobin-Yvon, Longjumeau, France).
2.2.3. Colour measurements
Colour measurements were done directly on fresh samples (maximum 3 days of storage at 4 °C) with a colorimeter (Luci 100, Dr Lange, Villeurbanne, France) in the L*, a* and b* systems. Samples were illuminated with D65 artificial daylight (10° standard angle). L*, a* and b* parameters present a maximal variation of, respectively, 1.5, 2.5 and 2.0% due to colorimeter uncertainty.
2.3. Experimental design
In this experiment, five holding temperatures were targeted – 100, 110, 120, 130 and 140 °C – and holding times were adapted according to the needs for kinetic data. Taking into account the excellent reproducibility of a thermal profile, it was decided not to repeat any time/temperature treatment but rather extend the number of sampling times (Tab. II). By this way, three experiments with five sampling times each, gave 15 different kinetic points per targeted holding temperature. So each point presented on the figures is issued from one sampling and was not repeated; standard deviations (SDs) represented are only due to the analytical methods. Another serial of points is issued from sampling during the heating phase at given temperature levels. The samples are taken from storage at 4 °C and left at ambient temperature to warm up to 10–15 °C before starting the thermal treatment in the reactor. In order to be able to compare the time/temperature treatments, all signals are registered as soon as a bulk temperature of 20 °C is reached by ohmic heating.
Experimental design.
The efficiency of a thermal treatment can be described by means of the sterilisation value (SV), calculated from time-temperature data:

Contribution of heating, holding and cooling phases to a thermal treatment targeting a SV of 144 s in the ohmic reactor and holding time necessary to achieve it.
3. RESULTS
Performances of the ohmic reactor: a typical temperature profile obtained for a full thermal treatment with five samplings is shown in Figure 3, together with the power signal delivered by the generator. Full power is delivered until the targeted temperature is reached and is then regulated to hold the temperature as long as necessary. The sampling/cooling device allowed a rapid cooling from holding temperature (100–140 °C) to < 100 °C in about 1 s and to < 25 °C in about 1.5 min (Fig. 3). The temperature profiles were very reproducible from one trial to another, as the relative SD obtained on holding temperature for more than 10 thermal treatments was lower than 1.5%. Besides, no fouling was observed on the electrodes or on the cell’s wall.
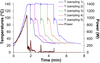 |
Figure 3. Example of temperature and power kinetics during a trial at 140 °C with five samplings. |
The contributions of heating, holding and cooling phases to the global SV were calculated from the experimental time/temperature data and are shown in Table III. The results show that the contribution of cooling to a total SV of 144 s is always negligible, showing good efficiency of the cooling device. The heating phase has no contribution to a total SV of 144 s at low temperatures from 100 to 120 °C but is no longer negligible for higher temperatures of 130 to 140 °C as it accounts from 30 to 100% of total SV. Although high levels of temperatures compatible with a UHT domain can be achieved with the ohmic reactor, a more powerful generator would be required to accelerate the heating phase.
Concerning the biochemical markers, soluble protein content decreases with treatment duration (Fig. 4A) because of protein denaturation. Results show that the holding temperature level seems to have no impact since all curves are confounded. Three stages are observed on soluble protein content during a thermal treatment: (i) constant, (ii) rapid decrease and (iii) stagnation. During the first stage lasting from 0 to 50 s, i.e. the time to reach 70 °C, soluble protein content remains stable. Then, a very brutal decrease takes place for about 40 s. Finally, soluble protein content stagnates at a value divided by five comparing to the initial value.
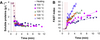 |
Figure 4. Evolution of soluble protein content (A) and FAST index (B) in function of time-temperature treatment. The lines represent a linear regression of the experimental data (SD represents the variability of the analytical method). |
FAST index increases with treatment time and the curves can also be divided into three stages (Fig. 4B). The first is the same as for soluble protein content, a constant step lasting 0–1 min. Then an exponential-like curve appears for about 30 s, before a linear behaviour with a slope increasing with temperature.
The two individual markers furosine and CML show the same profile (Fig. 5). As expected, results show the markers accumulating with time and temperature.
 |
Figure 5. Evolution of furosine (A) and CML (B) in function of time-temperature treatment. The lines represent a linear regression of the experimental data (SD represents the variability of the analytical method). |
Colorimetric measurements show a linear behaviour with time and temperature for the three components of the analysis (Fig. 6). Results are expressed as ΔL*, Δa* and Δb*, meaning that control values have been subtracted to sample values for each component and each temperature. ΔL* decreases, which indicates that colour turns from white to black. Δa* and Δb* increase, meaning that colour goes from green to red and from blue to yellow, respectively. The tendency for the three coordinates confirms browning of the samples.
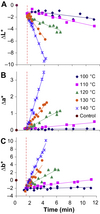 |
Figure 6. Evolution of the three components of colour, ΔL* (A), Δa* (B) and Δb* (C) in function of time-temperature treatment. The lines represent a linear regression of the experimental data (SD represents the variability of the analytical method). |
4. DISCUSSION
The evolution of the concentration of the five different indicators follows a similar trend, which can be divided into three steps: the first step corresponds to the absence of significant change in the marker’s concentration, due to low temperature (< 70 °C). Soluble protein content shows no evolution because milk protein denaturation needs a minimum of 72 °C to occur. Some milk proteins can be denatured at lower temperature levels (lactoferrin, immunoglobulin, etc.) but they are very minor components. FAST index remains constant because Maillard reaction is very slow under 80–90 °C.
The second stage presents an exponential-like curve and, as the first stage, corresponds to a thermal transient phase. Temperature increases continuously in the product until it reaches the holding temperature (100–140 °C).
The third step takes place during the temperature steady state period allowing identifying the kinetic variables of the selected Maillard reaction markers. They show a linear evolution with time, indicating a pseudo-zero order kinetic. This behaviour confirms previous data observed on CML and fluorescence on simple models composed of pure proteins, lactose, vitamin C and iron [22]. It is also coherent with Baisier et al. [4], who found pseudo-zero-order formation of fluorescence and brown pigments in a system containing glucose and glycine. But these studies were performed at lower temperatures (< 60 °C) for long heating times, quite far from the thermal conditions used in this study. Other works confirmed similar pseudo-zero order kinetic for brown compound formation in simple models (i.e. glucose + casein and lactose + casein) heated at high temperatures (110–150 °C) and short times (0–30 min). Lactulosyllysine formation was also described as following a pseudo-zero order kinetic in milk for time/temperature treatments of 0–100 min/110 °C [15].
The effect of temperature during the isothermal treatment can be modelled by an Arrhenius type of equation:
Kinetic parameters calculated for the four Maillard markers which follow a pseudo-zero order reaction during isothermal holding temperature.
Comparison of kinetic values in this study and in previous works.
An interesting aspect of the kinetic study in our system is related to the thermal transient step during which major changes can already be detected in the product; the heating phase is, therefore, expected to play a significant role in a high temperature/short time (HTST) industrial process. In fact, it contributes a lot to the SV at high temperatures and, therefore, to the production of Maillard reaction compounds. This step was neglected in models treated at low temperatures for long times, but increasing temperature is no longer negligible in an HTST process. Unfortunately, the previously mentioned authors did not present results on the unsteady heating phase [4, 24]. However, one study has quantified the effect of non-isothermal conditions on furosine formation [14] but the thermal conditions were very different from the one used in this study: the holding temperature was achieved in more than 30 min by successive isothermal steps of 10 °C for 5 min. Activation energy was calculated with a global method consisting in replacing the rate constant (k) by its Arrhenius equation expression in the pseudo-zero order linear relation and calculating globally a kref (rate coefficient for a reference temperature) and Ea. Results showed that Ea is not significantly different from the value obtained with iso-temperature data but kref presents a wide variation. A similar approach is being worked out in a coming paper, to use the parameters of our Arrhenius model identified under isothermal conditions and try and validate the model for the transient phase.
5. CONCLUSION
The experimental ohmic heating system designed for this work allowed precisely studying the kinetics of heat-dependent reactions, such as protein denaturation and Maillard reaction, under steady temperature conditions and relating them to quality parameters. It is an efficient tool as it conjugates facilities for heating, holding and cooling. However, it appears that higher heating rates would be required in the reactor to reduce the heating contribution to the total SV. The Maillard reaction in a complex food matrix like an IF occurs very fast under UHT conditions. The markers that were selected according to their ability to represent the advancement of the Maillard reaction did not allow distinguishing any theoretical step of the reaction: the succession of occurrence between early, advanced and final steps is not detectable within the time conditions used in a UHT treatment. The three-phase kinetics can partly be explained: the first step at low temperature and the third one at high steady temperature conditions are already well known. But the second phase, i.e. the transient thermal phase during which the product is heated from 70 °C to a sterilising temperature above 100 °C would be worth further exploring. In fact, industrial UHT treatments last only few seconds at high temperatures. It implies that for this type of process, Maillard reaction will occur just in this unknown part of the kinetics. More work is needed to understand and predict the kinetics of undesirable reactions occurring during this phase. Simple reaction schemes would be worth completing by selecting more reaction markers in order to be able to establish mass balances between consumed compounds and generated compounds versus reaction progress under unsteady thermal conditions.
Acknowledgments
The authors wish to particularly thank L. Fuentes for technical assistance. They are also grateful to ICARE European project for ordering and supporting this work (6th Framework Programme, Grant No. COLL-CT-2005-516415).
References
- Almaas R., Rootwelt T., Oyasaeter S., Saugstad O.D., Ascorbic acid enhances hydroxyl radical formation in iron-fortified infant cereals and infant formulas, Eur. J. Pediatr. 156 (1997) 488–492 [CrossRef] [PubMed].
- Arteaga G.E., Vazquez-Arteaga M.C., Nakai S., Dynamic optimization of the heat treatment of milk, Food Res. Int. 27 (1994) 77–82 [CrossRef].
- Ayadi M.A., Leuliet J.C., Chopard F., Berthou M., Lebouché M., Continuous ohmic heating unit under whey protein fouling, Innov. Food Sci. Emerg. Technol. 5 (2004) 465–473 [CrossRef].
- Baisier W.M., Labuza T.P., Maillard browning kinetics in a liquid model system, J. Agric. Food Chem. 40 (1992) 707–713 [CrossRef].
- Birlouez-Aragon I., De Saint Louvent E., Stahl P., Eveleigh L., Protein hydrolysis of infant formulas strongly activates the Maillard reaction, J. Pediatr. Gastr. Nutr. 39 (2004) 141–145 [CrossRef].
- Birlouez-Aragon I., Leclère J., Quedraogo C.L., Birlouez E., Grongnet J.F., The FAST method, a rapid approach of the nutritional quality of heat-treated foods, Nahrung/Food 45 (2001) 201–205 [CrossRef].
- Birlouez-Aragon I., Loquet N., De Saint Louvent E., Jouan-Rimbaud Bouveresse D., Stahl P., Evaluation of the Maillard reaction in infant formulas by means of front-face fluorescence, Ann. N. Y. Acad. Sci. 1043 (2005) 308–318 [CrossRef] [PubMed].
- Birlouez-Aragon I., Nicolas M., Matais A., Marchond N., Grenier J., Calvo D., A rapid fluorimetric method to estimate the heat treatment of liquid milk, Int. Dairy J. 8 (1998) 771–777 [CrossRef].
- Birlouez-Aragon I., Pischetsrieder M., Leclère J., Morales F.J., Hasenkopf K., Kientsch-Engel R., Ducauze C.J., Rutledge D., Assessment of protein glycation markers in infant formulas, Food Chem. 87 (2004) 253–259 [CrossRef].
- Birlouez-Aragon I., Sabat P., Gouti N., A new method for discriminating milk heat treatment, Int. Dairy J. 12 (2002) 59–67 [CrossRef].
- Bosch L., Alegria A., Farré R., Clemente G., Fluorescence and color as markers for the Maillard reaction in milk-cereal based infant foods during storage, Food Chem. 105 (2007) 1135–1143 [CrossRef].
- Brands C.M.J., Van Boekel M.A.J.S., Kinetic modeling of reactions in heated monosaccharide-casein system, J. Agric. Food Chem. 50 (2002) 6725–6739 [CrossRef] [PubMed].
- Brands C.M.J., Van Boekel M.A.J.S., Kinetic modelling of reactions in heated disaccharide-casein systems, Food Chem. 83 (2003) 13–26 [CrossRef].
- Charissou A., Ait-Ameur L., Birlouez-Aragon I., Evaluation of a gas chromatography/mass spectrometry method for the quantification of carboxymethyllysine in food samples, J. Chromatogr. A 1140 (2007) 189–194 [CrossRef] [PubMed].
- Claeys W.L., Ludikhuyze L.R., Hendrickx M.E., Formation kinetics of hydroxymethylfufural, lactulose and furosine in milk heated under isothermal and non-isothermal conditions, J. Dairy Res. 68 (2001) 287–301 [CrossRef] [PubMed].
- Eliot-Godéreaux S.C., Goullieux A., Quéneudec t'Kint M., Elaboration and kinetic modelling of the formation of a biochemical marker to quantify HTST processing, Food Res. Int. 36 (2003) 131–139 [CrossRef].
- Esty J.R., Meyer K.F., The heat resistance of the spores of B. Botulinus and allied anaerobes, J. Infect. Dis. 31 (1922) 650–663.
- Ferrer E., Alegria A., Farré R., Clemente G., Calvo C., Fluorescence, browning index and color in infant formulas during storage, J. Agric. Food Chem. 53 (2005) 4911–4917 [CrossRef] [PubMed].
- Gaze J.E., Brown K.L., The heat resistance of spores of Clostridium botulinum 213B over the temperature range 120 to 140 °C, Int. J. Food Sci. Technol. 23 (1988) 373–378.
- Ho C.T., Maillard reaction and health aspects, Mol. Nutr. Food Res. 50 (2006) 1099–1100 [CrossRef].
- Krajcovicova-Kudlackova M., Sebekova K., Schinzel R., Klvanova J., Advanced glycation end products and nutrition, Physiol. Res. 51 (2002) 313–316 [PubMed].
- Leclère J., Birlouez-Aragon I., Meli M., Fortification of milk with iron-ascorbate promotes lysine glycation and tryptophan oxidation, Food Chem. 76 (2002) 491–499 [CrossRef].
- Morales F.J., Romero C., Jiménez-Pérez S., Fluorescence associated with Maillard reaction in milk and milk-resembling systems, Food Chem. 57 (1996) 423–428 [CrossRef].
- Morales F.J., Van Boekel M.A.J.S., A study on advanced Maillard reaction in heated casein/sugar solutions: colour formation, Int. Dairy J. 8 (1998) 907–915 [CrossRef].
- Naranjo G.B., Malec L.S., Vigo M.S., Reducing sugars effect on available lysine loss of casein by moderate heat treatment, Food Chem. 62 (1998) 309–313 [CrossRef].
- Nielsen H.K., Finot P.A., Hurrell R.F., Reactions of proteins with oxidising lipids 2. Influence on protein quality and on the bioavailability of lysine, methionine, cyst(e) ine and tryptophan as measured in rat assay, Brit. J. Nutr. 53 (1985) 75–86 [CrossRef].
- Nielsen H.K., Löliger J., Hurrell R.F., Reactions of proteins with oxidising lipids 1. Analytical measurements of lipid oxidation and of amino acid losses in a whey protein-methyl linolenate model system, Brit. J. Nutr. 53 (1985) 61–73 [CrossRef].
- Pain J.-P., Dornier M., Baudez P., Le chauffage ohmique : innovation industrielle pour le traitement UHT des produits particulaires, IAA 6 (1994) 405–410.
- Pereira R., Martins J., Mateus C., Teixeira J.A., Vicente A.A., Death kinetics of Escherichia coli in goat milk and Bacillus licheniformis in cloudberry jam treated by ohmic heating, Chem. Pap. 61 (2007) 121–126 [CrossRef].
- Pereyra Gonzales A.S., Naranjo G.B., Malec L.S., Vigo M.S., Available lysine, protein digestibility and lactulose in commercial infant formulas, Int. Dairy J. 13 (2003) 95–99 [CrossRef].
- Schamberger G.P., Labuza T.P., Evaluation of front-face fluorescence for assessing thermal processing of milk, J. Food Sci. 71 (2006) C69–C74.
- Van Boekel M.A.J.S., Effect of heating on Maillard reactions in milk, Food Chem. 62 (1998) 403–414 [CrossRef].
- Yaylayan V.A., Huyghues-Despointes A., Polydorides A., A fluorescamine-based assay for the degree of glycation in bovine serum albumin, Food Res. Int. 25 (1992) 269–275 [CrossRef].
All Tables
Composition of the model IF; the main reaction substrates or catalysers are detailed in italics.
Contribution of heating, holding and cooling phases to a thermal treatment targeting a SV of 144 s in the ohmic reactor and holding time necessary to achieve it.
Kinetic parameters calculated for the four Maillard markers which follow a pseudo-zero order reaction during isothermal holding temperature.
All Figures
|
Figure 1. Simplified diagram of Maillard reaction in IF. |
| In the text | |
|
Figure 2. Simplified scheme of the thermal treatment installation. |
| In the text | |
|
Figure 3. Example of temperature and power kinetics during a trial at 140 °C with five samplings. |
| In the text | |
|
Figure 4. Evolution of soluble protein content (A) and FAST index (B) in function of time-temperature treatment. The lines represent a linear regression of the experimental data (SD represents the variability of the analytical method). |
| In the text | |
|
Figure 5. Evolution of furosine (A) and CML (B) in function of time-temperature treatment. The lines represent a linear regression of the experimental data (SD represents the variability of the analytical method). |
| In the text | |
|
Figure 6. Evolution of the three components of colour, ΔL* (A), Δa* (B) and Δb* (C) in function of time-temperature treatment. The lines represent a linear regression of the experimental data (SD represents the variability of the analytical method). |
| In the text | |