Free Access
Figure 6.
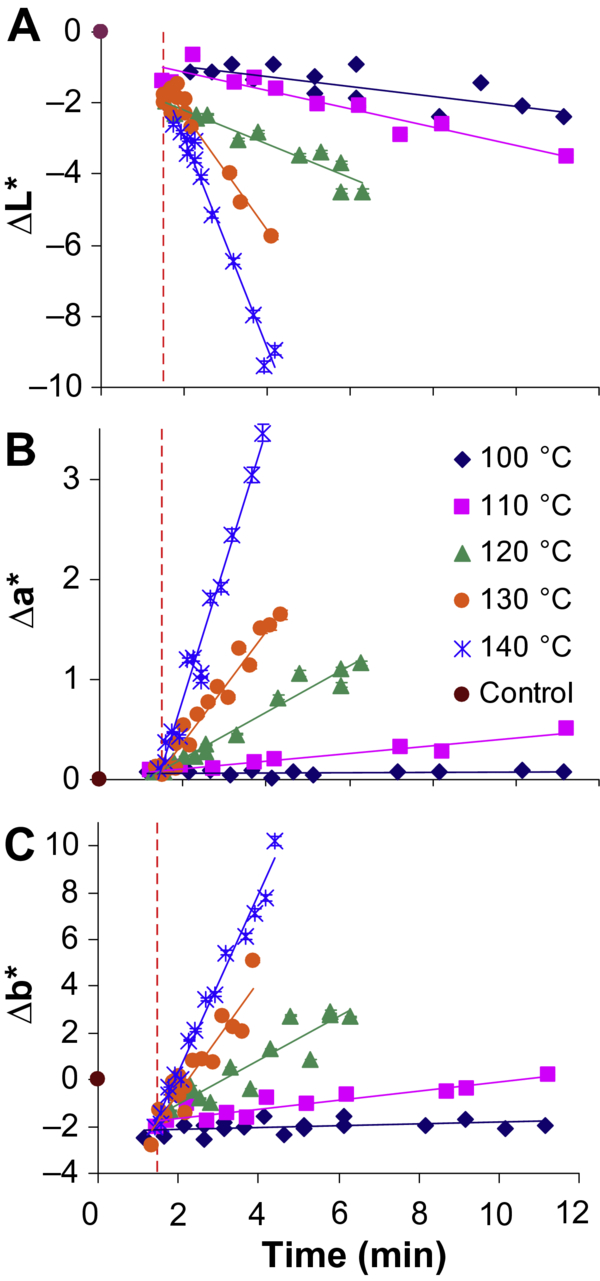
Evolution of the three components of colour, ΔL* (A), Δa* (B) and Δb* (C) in function of time-temperature treatment. The lines represent a linear regression of the experimental data (SD represents the variability of the analytical method).