Free Access
Figure 5.
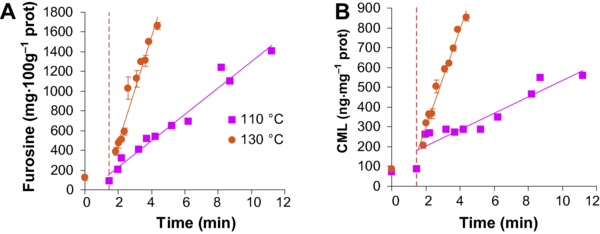
Evolution of furosine (A) and CML (B) in function of time-temperature treatment. The lines represent a linear regression of the experimental data (SD represents the variability of the analytical method).
Evolution of furosine (A) and CML (B) in function of time-temperature treatment. The lines represent a linear regression of the experimental data (SD represents the variability of the analytical method).