Free Access
Figure 4.
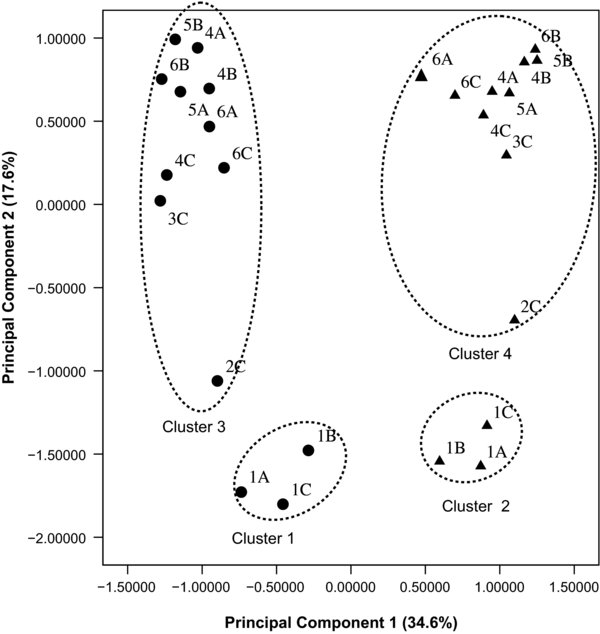
Score plots obtained from the PC analysis of processed peak height data from RP-HPLC of the pH 4.6-soluble fractions of Cheddar cheeses of Trials A, B and C made from milk containing 0 (1), 0.1 (2), 0.25 (3), 0.4 (4), 1 (5) or 2 (6) % equine blood serum after 1 (●) and 180 (▲) days of ripening. Groupings on the score plot indicate clusters as determined by hierarchical cluster analysis assuming an arbitrary linkage distance (squared Euclidean distance) cut-off of 12.