Free Access
Figure 3.
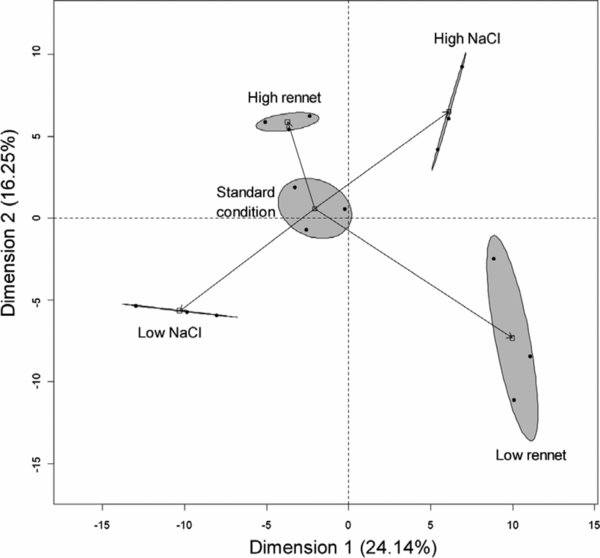
PCA of fluorescent RAP-PCR profiles obtained from RNA extracted from fermentation with low, standard and high concentrations of rennet and NaCl (as listed in Sect. 2). Gray shading represents the clustering of the three experimental repetitions (●) inside an ellipse which represents a confidence level of 95%. (□) Cluster’s barycenter.