| Issue |
Dairy Sci. Technol.
Volume 89, Number 3-4, May-August 2009
1st IDF/INRA International Symposium on Minerals and Dairy Products
|
|
|---|---|---|
| Page(s) | 335 - 348 | |
| DOI | https://doi.org/10.1051/dst/2009014 | |
| Published online | 14 May 2009 | |
Original article
Acid gelation of colloidal calcium phosphate-depleted preheated milk预处理对胶体磷酸钙酸凝胶形成的影响
Gélification acide de lait déplétés en phosphate de calcium et chauffés
Marie-Hélène Famelart1,2*, Géraldine Gauvin1,2, Denis Pâquet3 and Gérard Brulé1,2
1 INRA, UMR1253, Science et Technologie du Lait et de l’Œuf, 65 rue de St Brieuc, 35042 Rennes Cedex, France
2 AGROCAMPUS OUEST, UMR1253, Science et Technologie du Lait et de l’Œuf, 65 rue de St Brieuc, 35042 Rennes Cedex, France
3 DANONE Research, RD 128, 91767 Palaiseau Cedex, France
* Corresponding author (通讯作者): This email address is being protected from spambots. You need JavaScript enabled to view it.
Received: 25 September 2008
Accepted: 23 March 2009
This study aimed at understanding the role of colloidal calcium phosphate (CCP) in acid gelation of milk. Milks were depleted in Calcium (Ca) by dialysis against milk permeate containing a cation-exchange resin. Dialysed milks were then heated (90 °C-10 min) and acid-gelled at 42 °C with a yoghurt culture. Minerals, total and soluble protein contents, pH and optical density were measured in unheated and heated dialysed milk, together with diameters and ζ-potentials of particles. Dialysis of milk led to a dissociation of 45% total Ca and 30% total phosphorus, to an increase in sodium content and pH of milk, to lower turbidity and ξ-potential, but did not change the casein particle size. Soluble Ca and casein-bound Ca were removed from milk, CCP being removed increasingly, while Ca removed from the phosphoserine residues increased very little during the dialysis experiments. Maximal dissociation of αs1- and αs2-casein was 20%, while that of β- and κ-casein was 35–40% of total at the end of dialysis, and it increased after heating, especially for κ-casein. The pH value at which the milk sample begins to gel increased for low mineral depletion rates but decreased for higher depletion levels. This was due to the increase in the pH value of milk and in the κ-casein dissociation. The elastic modulus decreased in samples at the lowest depletion and then levelled off, which suggested that the phosphoserine-bound Ca played a critical role in the formation of acid gels.
摘要
胶体磷酸钙在乳的酸凝胶形成中起着重要的作用。牛乳经离子交换树脂脱钙。透析后的牛乳在90 °C加热10 min后,用酸奶发酵剂制成酸凝胶。分别测定未经热处理和热处理透析牛乳酸凝胶的pH, 总蛋白和可溶性蛋白、矿物元素、光密度、颗粒直径和 ζ-电势。透析作用使得乳中45% 的总钙和30% 总磷解聚,乳中钠的含量增加和pH提高,浊度和 ζ-电势降低,但是酪蛋白胶束颗粒大小没有改变。由于可溶性钙和酪蛋白结合钙从乳中去除,使得胶体磷酸钙大大减少;而在透析的实验中,从磷酸丝氨酸残基上结合钙的脱除则是非常小。透析后αs1-酪蛋白和αs2-酪蛋白的最大解聚率为20%,而β-酪蛋白和κ-酪蛋白的解聚率达到35%–40%,而在加热后解聚程度增加,特别是κ-酪蛋白解聚率更大。 对于较低矿物质脱除率的样品,牛乳开始形成凝胶的pH增加,但是对较高矿物质脱除率的样品,牛乳开始形成凝胶的则pH降低。这是由于乳pH和κ-酪蛋白解聚的增加。在最低的脱钙量,所有样品的弹性模量降低然后趋于稳定,原因是磷酸丝氨酸与钙的结合在酸性凝胶的形成中起到了关键作用。
Résumé
Cette étude a pour objectif de comprendre le rôle du phosphate de calcium colloïdal (CCP) dans la gélification acide du lait. Dans ce but, les micelles de caséines ont été déplétées en CCP par dialyse de lait contre un perméat de lait contenant une résine échangeuse de cations. Les laits dialysés étaient ensuite chauffés (90 °C-10 min) et gélifiés à 42 °C par acidification avec une culture bactérienne de yaourt. Les minéraux, les protéines totales et solubles, le pH et la blancheur ont été mesurés dans les laits dialysés chauffés et non chauffés, ainsi que le diamètre et le potentiel ζ des particules. La dialyse a entraîné une solubilisation maximale de 45 % du calcium total et de 30 % du phosphore total, une augmentation des teneurs en sodium et du pH, une densité optique réduite des laits et de plus faibles potentiels ζ, mais n’a pas eu d’effet sur la taille des particules. Le Ca soluble et le Ca lié à la caséine diminuaient dans le lait, le CCP diminuant régulièrement, tandis que le Ca lié aux phosphosérines diminuait peu, au fil de la dialyse. La dissociation de la caséine s′élevait à 20 % (caséines αs1 et αs2) et 35–40 % (caséines β et κ) dans le lait en fin de dialyse et augmentait après le traitement thermique, particulièrement pour la caséine κ. Le pH de gélification augmentait pour de faibles déplétions minérales et diminuait pour des plus fortes déplétions. Ceci s′expliquait par l’augmentation du pH du lait et de la dissociation de la caséine κ après le chauffage. Le module élastique diminuait pour les faibles déplétions en minéraux et n′évoluait plus pour des déplétions croissantes, ce qui suggère que le calcium lié aux phosphosérines est primordial dans la formation du gel acide.
Key words: colloidal calcium phosphate / CCP / acid milk gel / dialysis
关键字 : 胶体磷酸钙 / CCP / 乳的酸凝胶 / 透析
Mots clés : phosphate de calcium colloïdal / CCP / gélification acide / dialyse
© INRA, EDP Sciences, 2009
1. INTRODUCTION
Many studies deal with the dissociation of colloidal calcium phosphate (CCP) from milk, mainly to understand the structure of casein micelles. For this purpose, either calcium-chelating agents [30, 33, 39, 40, 42] or calcium (Ca) phosphate buffers [27, 39] or polyphosphate salts were added to milk [6, 11, 12, 34]. In some studies, Ca-chelating agents or diluents were gently added using dialysis [13, 16, 20, 21, 26, 31, 32] and sometimes ion-exchange resins were used in dialysis experiments [21] or in tank batch processes [35]. Most of these studies deal with the CCP solubilisation from milk, as soluble contents in both Ca and inorganic phosphate (Pi) were reported to increase. But, changes in the salt partition depend on the way used to decrease colloidal salts. With ethylenediamine-tetraacetate (EDTA) or citrate addition in milk, colloidal Ca and Pi decrease with a concomitant increase in soluble Ca [33], while when these chelatants are added in a dialysis experiment, there is no increase in soluble Ca [16, 21, 26]. Ca is present in the casein micelle as two components: CCP and Ca directly bound to phosphoserine residues [24]. Due to different association constants of Ca for organic phosphate (Po) and Pi and to the low solubility of Ca inorganic phosphate salts, Ca in milk is present 1/3 in the soluble phase of milk, 1/6 bound to the phosphoserines and 1/2 in CCP [29]. According to Le Graët and Brulé [24], acidification to pH 5.2 as performed in [27] solubilises mainly CCP, probably as did Ca chelatants, but Odagiri and Nickerson [30] reported that EDTA could make both forms of micellar Ca diffusible, while with citrate addition only CCP becomes diffusible. For example, calculations according to Mekmene et al. [29] show that addition of trisodium citrate at 10 and 20 mmol·L−1 lead to a reduction in Ca as CCP of 50% and 98%, respectively, but also to a reduction in phosphoserine-bound Ca of 5% and 11%. Citrate is less efficient in Ca solubilisation than EDTA, due to weaker chelating properties [29, 39]. Few studies on CCP depletion investigated the functional properties of demineralised casein micelles, such as acid or rennet gelation [6, 11–13, 33, 40].
Results report that CCP reduction by addition of citrate or EDTA in dialysis experiments is accompanied by a reduction in the turbidity of milk and by casein dissociation, sometimes up to destruction of casein micelles. A low CCP depletion using trisodium citrate addition to milk [33] has been reported to increase the elastic modulus G′ of acid gels and to reduce whey separation, because of facilitated rearrangement and molecular mobility of the micelle structure.
In acid gel formation, the micelle undergoes mineral solubilisation and casein dissociation [8, 9]. The aim of this study was therefore to understand whether or not the initial structure and mineralisation of the casein micelle have consequences on the final acid gel. For this purpose, casein particles were depleted in CCP by dialysis of reconstituted milk against a weak cation-exchange resin and then yoghurts were manufactured with the modified milks.
2. MATERIALS AND METHODS
2.1. Materials
Skim milk was reconstituted from low heat skim milk powder (whey protein nitrogen index = 9.5) [36], at 132 g·kg−1 dry matter into agitated deionised water and equilibrated for 2 h at room temperature.
In addition, fresh skim milk from a local plant (Entremont Alliance, Montauban, France) was pasteurised at 66 °C for 20 s and ultrafiltered on an 8 kg·mol−1 molecular weigh cut-off (MWCO) membrane (Tami industries, Nyons, France). Milk ultrafiltrate (UF) was then sterilised by filtration using a 0.2-μm sterile membrane (Nalgène, Fisher Scientific, Illkirch, France) and stored at 4 °C. Milk UF was obtained from fresh skim milk, because too much powder would have been necessary for the preparation of the large required volumes of UF. As fresh skim milk contains 100 g·kg−1 dry matter, it had a lower lactose concentration than the reconstituted milk. Lactose was added to milk UF (UF+) just before dialysis to reach a final content of 72.03 g·kg−1 based on the lactose contents of fresh and reconstituted milk. Yet, the reconstituted milk was richer in every soluble component than the UF+, except for lactose.
Milk was then dialysed into dialysis bags (MWCO 8000 g·mol−1, Spectra Por, 54-mm flat width) at 4 °C against a weak cation-exchanger resin with carboxylate functional groups (Macro Prep CM, Bio-Rad, Marnes-la-Coquette, France) suspended in UF+.
Three dialyses were performed as follows:
In D1 dialysis, 8 fractions of 20 mL of milk were dialysed against 1.5 L of UF+ containing 210 mL of resin (dialysis bag surface ~ 313 cm2).
In D2 dialysis, 4 fractions of 140 mL of milk were dialysed against 4 L of UF+ containing 850 mL of resin (dialysis bag surface ~ 731 cm2).
In D3 dialysis, 3 fractions of 140 mL of milk were dialysed against 3 L of UF+ containing 900 mL of resin, added stepwise: 300 mL at 0 h, 14.25 h and 21.75 h since the beginning of dialysis (dialysis bag surface ~ 542 cm2). Samples of milk were taken for analysis just before addition of resin.
Samples from the three dialysis experiments were removed at different times during the dialysis and were analysed. A fraction of D2 and D3 samples was introduced to a glass tube and heat-treated at 90 °C for 24 min by immersing in a water bath (10 min come-up time).
Heat-treated samples were equilibrated for 2 h at 42 °C and inoculated with lyophilised non-ropy cultures of Streptococcus thermophilus ST060 and Lactobacillus bulgaricus LB340 (Danisco France, Dangé-Saint-Romain, France) at 0.02 U·L−1. Acidification was monitored with time using a thin pH electrode (Inlab 423, Mettler Toledo, Paris, France) immersed in the rheometer cylinder. Low amplitude dynamic oscillation was performed in a rheometer (AR1000, TA instruments, Waters, St Quentin-en-Yvelines, France) at 42 °C, 1 Hz and 0.1% strain. The sample was covered with a thin layer of paraffin oil to avoid evaporation. The gel time (tgel) was defined as the point where the elastic modulus (G′) > 1 Pa.
2.2. Analysis
Physicochemical changes in the casein micelles induced by the dialysis process were observed to understand the role of the CCP on the structure of the casein micelle and on the acid gelation of milk. As indicators of casein micelle disintegration, partition of minerals between diffusible and casein micelle phases, optical density (OD) of milk, particle size and zeta potential of casein micelles were measured. A change in the zeta potential of casein micelles could relate to a change in the composition of casein micelles.
2.2.1. Nitrogen
Total nitrogen (TN), non-casein nitrogen (NCN) and non-protein nitrogen (NPN) contents were determined from N analysis by the Kjeldahl method using Kjeltec digestion system (Técator, Höganäs, Sweden). The converting factors were 6.38, 6.25 and 6.19, respectively. The whey protein and casein contents were determined as NCN-NPN and TN-NCN. Measurements were performed in duplicate, except for NPN that was performed only once.
2.2.2. Lactose
Ten millilitre of 0.5 N NaOH were added to 0.25 g milk, and ~ 150 mL water were added. Ten millilitre of 100 g·L−1 zinc sulfate were added and the sample was made up to 200 mL with water. After stirring, this dilution was left undisturbed for 15 min at 20 °C and filtered on a 40 Whatman filter (Whatman GmbH, fDassel, Germany). One millilitre of 50 mL·L−1 phenol solution was added to 1 mL filtrate in a glass tube, the solution was stirred and 5 mL concentrated sulphuric acid was then added to the bottom of the tube and stirred. The tubes were heat-treated (100 °C for 10 min), cooled down and the coloured compound was measured at 490 nm after 1:30 h at room temperature. Lactose solutions from 0 to 0.1 g·kg−1 were used as standards.
2.2.3. Minerals
Milk was ultrafiltered on an Ultra free 15 membrane (MWCO 10 000 g·mol−1) (Vivascience, Palaiseau, France) at 20 °C to obtain the diffusible phase. Ca and sodium (Na) concentrations in milk and diffusible phase were determined by atomic absorption spectrometry [14]. Phosphorus (P) was determined by a colorimetric method [22]. Two dilutions were prepared by sample and two measurements were performed on each dilution. Organic phosphorus (Po) content in milk was estimated according to Gaucheron et al. [15], corrected for the dilution of dialysed milks and used for the calculation of Pi. Inorganic casein-bound minerals were calculated as the difference between total inorganic and soluble contents.
2.2.4. Soluble casein – HPLC
Colloidal and soluble proteins were separated by centrifugation at 50 000× g for 90 min at 20 °C and the supernatants were carefully removed. Milks and supernatants were frozen until analysis by reversed phase liquid chromatography (RP-HPLC) after reduction with dithiothreitol [23]. Soluble casein was calculated as its integrated peak area in the supernatant relative to its area in milk. After reduction of samples, α-lactalbumin and β-lactoglobulin were eluted together in a broad peak at the end of the chromatogram, so that it was not possible to evaluate the content of residual native whey proteins either in unheated or heated milk [23]. Two injections per sample were performed.
2.2.5. Optical density of milk
Optical density of milk samples diluted using deionised water at 1/50 (v/v) was immediately measured at 600 nm. Ten dilutions and measurements were made to achieve a high accuracy.
2.2.6. Particle size and zeta potential
The apparent hydrodynamic diameter of particles was calculated from photon correlation spectroscopy at a scattering angle of 90°, while ζ-potential was deduced from their electrophoretic mobility at 25 °C with a Malvern Zeta sizer 3000 HS (Malvern Instruments SA, Orsay, France) in a 1000-fold dilution of milk in a buffer containing 20 mmol·L−1 imidazole, 50 mmol·L−1 NaCl and 5 mmol·L−1 CaCl2 at pH 7 and at 25 °C [7]. The mean of 7–10 measurements for particle size and of five measurements for ζ-potential were obtained.
2.3 Calculations
The contents in casein-bound Ca and Pi removed from milk at time (t) during the dialysis were obtained by the differences between casein-bound contents at the beginning of the dialysis and casein-bound contents at t, in moles. The resin was initially in the form of a carboxylate salt of sodium. During the dialysis process, Na and Ca exchanged together, and Na replaced Ca in the milk salts. We assumed that an increase in Na content of dialysed milk was mainly due to the replacement of one mole of Ca by 2 moles of Na at the phosphoserine residues. As the dialysate was ultrafiltrate, the soluble phase of milk was in equilibrium with this ultrafiltrate, and thus, the increase in sodium content in milk was not ascribed to an increase in the ionic strength of milk. This allowed calculating the part of casein-bound Ca removed from the phosphoserines and by deduction, the one removed from the CCP. The ratio of the Ca removed from CCP to the casein-bound Pi removed from milk was so estimated in mol·mol−1 and compared to the composition of CCP.
3. RESULTS
The three dialysis experiments (D1, D2 and D3) were performed in different experimental conditions. Dialysis D1 was first performed with small milk volumes and frequent sampling to test the time range necessary to observe sufficient changes in the mineral contents of milk. These volumes did not allow the samples to be heat-treated and acidified. The D2 dialysis was performed to test the effect of the depletion in minerals on acid gelation properties of milk, and the D3 to test if successive additions of resins were a means to enhance the mineral depletion. Despite the differences in experimental conditions, the compositions of dialysed milks were similar among the three experiments. It was possible to draw some general trends.
For unknown reason, greater standard deviation values were obtained for the casein concentration in D3 than in D2 experiment (Tab. I).
Physicochemical characteristics of milk samples during dialysis against a weak cation exchanger. D2 and D3 are two repetitions of the dialysis experiment. tdialysis, time of dialysis; WP, whey proteins; tgel, gelation time; pHgel, gelation pH; tanδmin, minimum value of tanδ just after gelation; tanδ800, tanδ at 800 min; Δtan, difference between maximal and minimal value of tanδ; G′800, G′ at 800 min; tanδ800, tanδ at 800 min.
Figures 1a and 1b show that total Ca and P decreased rapidly in the first hours of dialysis and with an almost linear decrease until 40 h of dialysis. After ~ 40 h of dialysis, ~ 40% of total Ca and ~ 30% of total Pi were removed from milk. Casein-bound and total minerals decreased following the same trends at the different times of dialysis. Soluble Ca and Pi decreased slightly, mainly during the first 20 h of dialysis and then reached a plateau (Fig. 1c). As casein-bound Ca and Pi were removed from milk, CCP was solubilised, with or without Ca bound to organic phosphorus. The calculated ratio of casein-bound Ca/casein-bound Pi that was removed from milk was ~ 8.61 ± 0.96 mol·mol−1 at ~ 15 h of dialysis and ~ 2.86 ± 0.61 mol·mol−1, at ~ 40 h of dialysis. The ratio of Ca/Pi in CCP is 1–1.7 mol·mol−1 [19], and these high ratio values suggest that a higher content of Ca was removed from milk than Pi, as compared to CCP and that Ca directly bound to phosphoserine was probably also removed from milk. Figure 1d shows that Na contents in milk samples increased of ~ 10 mmol·kg−1 during the first 14 h of dialysis and then levelled off. This indicates that a maximum of 5 mmol·kg−1 Ca were replaced by Na on dialysis, as 2 moles of Na replaced 1 mole of Ca on the phosphoserine residues. This exchange was observed mainly at the beginning of the dialysis experiment. In the sample at 14 h of dialysis, the casein-bound Ca decrease was ~ 9.15 mmol·kg−1 and that of Pi was ~ 1.87 mmol·kg−1. The sodium increase was ~ 9.76 mmol·kg−1 and as ~ 9.76 mmol·kg−1 Na replaced 4.88 mmol·kg−1 Ca on phosphoserine residues, only 4.27 mmol·kg−1 (9.15 − 4.88) Ca were removed from CCP. It follows that the ratio of the Ca/Pi removed and supposed to be CCP was ~ 2.3 ± 0.8 mol·mol−1 after ~ 14 h of dialysis. In the sample at ~ 40 h of dialysis, the casein-bound Ca decrease was ~ 13.69 mmol·kg−1 and that of Pi was ~ 4.88 mmol·kg−1. As ~ 11.29 mmol·kg−1 Na replaced 5.65 mmol·kg−1 Ca on phosphoserine residues, only 8.04 mmol·kg−1 (13.69 − 5.65) Ca were removed from CCP. It follows that the ratio of the Ca/Pi removed and supposed to be CCP was ~ 1.65 ± 0.5 mol·mol−1 after ~ 40 h of dialysis. These values of Ca/Pi calculated for CCP removed from the casein micelle agree with a tricalcium-phosphate structure as suggested by Schmidt cited by Holt [19].
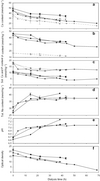 |
Figure 1. (a) Total (closed black symbols) and casein-bound (closed grey symbols) calcium. (b) Total (closed black symbols) and inorganic casein-bound (closed grey symbols) phosphate. (c) Soluble calcium (closed symbols) and phosphate (open symbols). (d) Total sodium. (e) Milk pH. (f) OD of unheated milk samples as a function of the dialysis time for three dialysis experiments, D1 (♦), D2 (■) and D3 (●). The three dialysis were performed against a milk permeate containing a weak cation-exchanger. Bars are the standard deviations. |
On dialysis, the pH of milk increased to 7.1–7.3 (Fig. 1e). The pH change was asymptotic in D1 and D2 dialysis, with a plateau caused by saturation of the exchanger. In D3, the increase was linear, due to the addition of resin at three repeated times.
Figure 2a shows the percent of soluble casein in milk during the D3 dialysis. Less than 5% of each casein was soluble after 22 h of dialysis, i.e. when 26% of total Ca was removed, while 20–38% of each casein became soluble after 38 h of dialysis, i.e. when 44% of total Ca was removed. The solubility of the four caseins therefore depended on the mineral depletion in unheated samples. β-casein was the most soluble casein (38% soluble). Heat treatment did not change the solubility of αs1-, αs2- and β-casein, apart from a very small increase, while κ-casein was largely dissociated from the micelle by the heat treatment, even at a low mineral depletion (25% of total Ca removed) and its dissociation was weakly related to the level of depletion, as an increase in depletion from 25% to 44% of Ca did not significantly change it. Soluble κ-casein at t0 was ~ 40% of its total content, a value a little bit higher than the one reported for reconstituted milk at this dry matter content (36% according to Anema [1]).
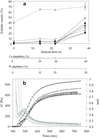 |
Figure 2. (a) Soluble casein contents in milk during dialysis D3 obtained by RP-HPLC. Values were calculated as the percent peak area of each casein in supernatant to its area in milk. Dialysed milks were either non-heat-treated (close symbols) or heat-treated (90 °C-24 min) (open symbols): αs1-casein (■, □), αs2-casein (♦, ◊), κ-casein (, ∆) and β-casein (●, ○). The mineral depletions are the reduction in total contents in percent of the content in undialysed milk. (b) Elastic modulus (G′, in black) and loss tangent (tanδ, in grey) during acid gelation of milk samples dialysed (dialysis D2) for 0 h (○), 14.5 h (∆), 22.08 h (□), 38.42 h (◊) and 43.08 h (+). |
Depletion in Ca and P was accompanied by a linear decrease in the OD of milk (Fig. 1f), while the size of milk casein particles remained constant (P < 0.03, according to a Student t test) (Fig. 3). The absolute ζ-potential of unheated dialysed milks decreased during dialysis, indicating a reduced negative charge with the depletion in Ca phosphate, as shown in Table I with the Student t test. When milk samples were heat-treated, no change in particle size could be found (results not shown), while the absolute ζ-potential decreased, meaning a reduced negative surface charge. It must be pointed out that the samples at zero time from D2 and D3 were significantly different for unknown reasons.
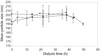 |
Figure 3. Mean particle size in dialysed milk as a function of the dialysis time for three dialysis experiments, D1 (♦), D2 (■) and D3 (●). The particle size values of all samples were not significantly different according to a Student t test (P < 0.03). |
During dialysis, the casein content decreased from its initial value (Tab. I). The dilution was 14.2% and 6.7% ([initial content − final content]/initial content) in D2 and D3, respectively. This was due to the transfer of water from the outside permeate to the inside milk. This has been checked during the D3 dialysis by weighing the dialysis bags before emptying them. Addition of lactose in the outside permeates probably limited transfers, but was not sufficient to reach equilibrium. NPN in milk decreased in a larger extent than other nitrogen fractions, due to its transfer towards the outside compartment. We have experimentally checked what would have been the effect of dilution on the OD of milk. It would have explained the reduction of the OD from 21.47 (value at t0) to 18.0 in D2 experiment and from 16 (value at t0) to 15.49 in D3. This dilution explained a part of the reduction in the OD of milk, but is insufficient to explain its overall reduction.
A light depletion of minerals (~ 20% Ca and 10% Pi) induced gelation at more alkaline pH values than un-depleted milk (~ 5.4–5.6 vs. 5.3 for control milk), but the pH at which the milk sample begins to gel (pHgel, i.e. the gelation pH) shifted towards lower pH values for larger mineral depletions (Tab. I and Fig. 2b). There was no change in the acidification kinetics between milks obtained at different times of dialysis, but the overall kinetics were shifted to higher pH values as the time of dialysis increased (not shown). The G′ value at 800 min decreased by 25% of the control G′ after 14 h of dialysis (~ 20% depletion in total Ca) and did not change for higher depletions. The decrease of G′ at 14 h of dialysis cannot be explained by the low (< 5%) dilution of milk, because a dilution of milk of ~ 12% is required to get such G′ value (result not shown). However, at later stage, the dilution of milk can explain the reduction in the G′ of the acid gel. The value of tanδ at 800 min increased with the extent of dialysis of milk, meaning less solid-like gels with mineral depletion. A peak for tanδ at ~ pH 5 was always present on the gelation curves. Furthermore, the height of the local maximum for tanδ was constant (~ 0.07), meaning that the whole tanδ-time curve was upward shifted with increasing mineral depletion.
4. DISCUSSION
In the current dialysis procedure, the cation-exchanger resin was present to efficiently dissociate CCP from milk. Without it, due to the low solubility of Ca inorganic phosphate, this dissociation would have been very limited and low. The resin in the UF compartment was used to bind ionic Ca and displaced ionic Ca from milk to the dialysate. This was supposed to efficiently and gently displace CCP towards the soluble phase of milk, as Ca2+ needed to re-increase, without casein micelle disintegration. Then, according to association constants, micellar Ca could be re-equilibrated between Pi and Po. If the resin had been added in the milk compartment, all Ca forms could have been solubilised, probably leading to significant micelle disintegration. Using a resin will solubilise selectively ionic Ca, as compared to a simple dialysis process that transfers all soluble compounds according to their concentration gradients.
A mineral depletion of casein micelles was evidenced (Figs. 1a and 1b) and was accompanied by a pH increase of ~ 0.5 units in milk, as in Odagiri et al. [30]. This effect was due to the solubilisation of HPO42−, following the complexion of Ca by the cation exchanger. Considering the following equilibrium:

Reducing mineral contents of ~ 40% of Ca and 30% of P in milk by dialysis was shown to decrease milk OD, besides milk dilution, without any decrease in milk particle diameter, in agreement with other studies [16, 26, 40]. According to Lin et al. [26], Ca depletion dissociates weakly bound β- and κ-caseins, while the micellar framework of αs-casein is kept unchanged, which explains the constant micellar size. Conversely, according to Griffin et al. [16], the reduced OD is related to losses in micellar material and explained by a reduced number of intact micellar particles. Identically, if milk is diluted or phosphate is added to milk, the OD decreases during the dissociation of caseins, without any change in the structure of micelles as observed by light scattering [34]. These authors concluded that during micelle dissociation, the particle is either intact or completely dissociated, and that the OD decrease can be imparted to a reduction in the number of intact micelles. We have shown that the increase in β- and κ-casein solubility at the higher mineral depletion (~ 40% of total Ca) was larger than that of the other caseins. A micellar dissociation process with either intact or completely dissociated micelles cannot induce such a selective casein dissociation. Moreover, in the current study the decrease in OD was not related to the casein dissociation, as the dissociation of casein did not increase linearly with time, while OD did. The decrease in milk OD for low mineral depletions, without any reduction of particle diameter and without casein dissociation could only be explained by removing minerals from the casein particles. On the other hand, at greater mineral depletions, the OD decrease could be due to the dissociation of κ- and β-caseins and by the dilution of milk.
The total disaggregation of the casein micelle has been reported for Ca removing larger than 50% [16, 33]. It would have been interesting to further extend the mineral depletion. This could have been performed by using successive additions of resin, because D1 and D2 experiments evidenced the resin saturation, while D3 did not, considering for instance the pH changes (Fig. 1e).
Heat treatment of milk at 90 °C for 24 min is known to dissociate κ-casein [2] and it is thought to be a major factor on the rheological properties of acid gels obtained from pre-heated milk [3]. Dissociation of κ-casein on heating was higher in Ca phosphate depleted milk, possibly as a result of its higher pH value, as the pH of heat treatment strongly affects casein dissociation [2, 38]. On itself, the increase in mineral depletion from 20% to 40% did not steeply change the κ-casein dissociation after heating. In fact, it has already been reported that heat-induced dissociation of κ-casein in CCP-depleted milk is more related to the pH of depleted milk before heating than to the level of mineral depletion [4, 5, 37].
A decrease in the ξ-potential of particles in dialysed milk was evidenced that may decrease the particle stability and hasten acid gelation. As the mobilities of particles in all samples were measured in the same buffer, reduction in the surface charge of particles with mineral depletion cannot be ascribed to changes in the density or thickness of the ionic double layer. The decrease in the surface charge also arose without significant casein dissociation. Therefore, the results were explained by conformational changes on the micelle surface due to the changes in mineral contents and not by a change in the proportion of micellar caseins.
Regarding G′ values of the final gel, a decrease was observed between control milk and milk sample depleted of ~ 20% of Ca, i.e. dialysed for ~ 14 h. For the samples at a higher depletion rate, no changes in the G′ value of the final acid gel has been found. The Ca that was removed from the phosphoserine residues was shown to increase very little between 14 and 40 h of dialysis (4.88 mmol·kg−1 at 14 h and 5.65 mmol·kg−1 Ca at 40 h), while the Ca removed from the CCP went on increasing during dialysis (4.27 mmol·kg−1 at 14 h and 8.04 mmol·kg−1 at 40 h). In conclusion, the decrease in final G′ between 0% and 20% Ca depletion was related to the depletion in phosphoserine-bound Ca, which levelled off at ~ 14 h of dialysis, rather than to the depletion in CCP that progressed during the whole dialysis. This would lead to the conclusion that rheological properties of the acid gel depended more on the initial phosphoserine-bound Ca than on the initial CCP content of the casein micelle. Additionally, if the structure of the acid gel depends on the structure of casein particles in the gel, the role of CCP in maintaining the casein micelle structure could be debatable. Indeed, the dissociation of CCP between pH 6.6 and 5.2 observed during milk acidification is not accompanied by the disaggregation of the casein micelle [18]. Moreover, the disaggregation of the micelle takes place when the phosphoserine-bound Ca begins to solubilise, i.e. at pH 5.2 [24].
The increase in the gelation pH of milk at low mineral depletions, as expected from the reduced stability of particles, could be explained by the increase in κ-casein dissociation. Indeed, it has been shown that heat treatment of milk induces the formation of κ-casein-β-lactoglobulin complexes that are responsible for a higher value of the gelation pH [10, 17, 28]. For higher levels of mineral depletions, the pH of milk before heat treatment and the heat-induced κ-casein dissociation no longer increased. In this case, only a decrease in the gelation pH was observed. This decrease could be ascribed to an increase in ionic strength in depleted milk as increasing ionic strength in milk is known to decrease the apparent pK values of ionic groups on caseins and hence to decrease the gelation pH [12].
The local maximum of tanδ has been explained by the loosening of the network resulting from the solubilisation of CCP during acidification [25]. Furthermore, when CCP is previously solubilised by citrate addition, this maximum disappears [33]. The current results however disagree, as the peak for tanδ was always present, regardless the extent of CCP dissociation. Besides, the amplitude of the local maximum was always constant and was therefore probably not related to the solubilisation of CCP during milk acidification. The addition of trisodium citrate in the work of Ozcan-Yilsay et al. [33] could increase the ionic strength in milk and hence reduce the gelation pH [12]. This reduction in the gelation pH is visible in their work (from 5.3 to 4.9) and prevents observation of the tanδ maximum, located at pH values ~ 5, while the peak was still present in the current work.
5. CONCLUSIONS
Dialysis of milk against a weak cation-exchange resin depleted the micelle in CCP and phosphoserine-bound Ca, increased the milk pH and decreased the surface charge and the OD of casein micelles, without changing their size. An increase in the gelation pH was observed at Ca depletion < 30%, explained by an increase in the heat-induced κ-casein dissociation, while a greater depletion decreased the gelation pH. The viscoelastic modulus decreased at the lowest mineral depletion, probably because of the depletion in phosphoserine-bound Ca.
Acknowledgments
We acknowledge M. Piot and J. Jardin for technical assistance and Danone Research for its financial support.
References
- Anema S.G., Effect of milk concentration on
heat-induced, pH-dependent dissociation of
casein from micelles in reconstituted skim
milk at temperatures between 20 and
120
 C, J. Agric. Food Chem. 46 (1998)
2299–2305 [CrossRef].
C, J. Agric. Food Chem. 46 (1998)
2299–2305 [CrossRef].
- Anema S.G., Klostermeyer H., Heatinduced,
pH-dependent dissociation of
casein micelles on heating reconstituted
skim milk at temperatures below 100 C,
J. Agric. Food Chem. 45 (1997) 1108–1115 [CrossRef].
- Anema S.G., Lee S.K., Lowe E.K., Klostermeyer H., Rheological properties of acid gels prepared from heated pH-adjusted skim milk, J. Agric. Food Chem. 52 (2004) 337–343 [CrossRef] [PubMed].
- Anema S.G., Li Y., Further studies on the heat-induced, pH dependent dissociation of casein from the micelles in reconstituted skim milk, Lebensm-Wiss. Technol. 33 (2000) 335–343 [CrossRef].
- Aoki T., Kako Y., Relation between micelle size and formation of soluble casein on heating concentrated milk, J. Dairy Res. 50 (1983) 207–213 [CrossRef].
- Auty M.A.E., O'Kennedy B.T., Allan-Wojtas P., Mulvihill D.M., The application of microscopy and rheology to study the effect of milk salt concentration on the structure of acidified micellar casein systems, Food Hydrocoll. 19 (2005) 101–109 [CrossRef].
- Dalgleish D.G., Measurement of electrophoretic mobilities and zeta-potentials of particles from milk using laser Doppler electrophoresis, J. Dairy Res. 51 (1984) 425–438 [CrossRef].
- Dalgleish D.G., Law A.J.R., pH-Induced dissociation of bovine casein micelles. I. Analysis of liberated caseins, J. Dairy Res. 55 (1988) 529–538 [CrossRef].
- Dalgleish D.G., Law A.J.R., pH-Induced dissociation of bovine casein micelles. II. Mineral solubilization and its relation to casein release, J. Dairy Res. 56 (1989) 727–735 [CrossRef].
- del Angel C.R., Dalgleish D.G., Structures and some properties of soluble protein complexes formed by the heating of reconstituted skim milk powder, Food Res. Int. 39 (2005) 472–479 [CrossRef].
- Famelart M.H., Le Graët Y., Raulot K., Casein micelle dispersion into water, NaCl and CaCl2: physicochemical characteristics of micelles and rennet coagulation, Int. Dairy J. 9 (1999) 293–297 [CrossRef].
- Famelart M.H., Lepesant F., Gaucheron F., Le Graët Y., Schuck P., pH-Induced physicochemical modifications of native phosphocaseinate suspensions: influence of aqueous phase, Lait 76 (1996) 445–460 [CrossRef].
- Fox P.F., Hearn C.M., Heat stability of milk: influence of dilution and dialysis against water, J. Dairy Res. 45 (1978) 149–157 [CrossRef].
- Gaucher I., PiotM.,Beaucher E.,Gaucheron F., Physico-chemical characterization of phosphate-added skim milk, Int. Dairy J. 17 (2007) 1375–1383 [CrossRef].
- Gaucheron F., Le Graët Y., Schuck P., Équilibres minéraux et conditions physicochimiques, in: Gaucheron F. (Ed.), Minéraux et produits laitiers, Tec & Doc, Paris, France, 2004, pp. 219–280.
- Griffin M.C.A., Lyster R.L.J., Price J.C., The disaggregation of calcium-depleted casein micelles, Eur. J. Biochem. 174 (1988) 339–343 [CrossRef] [PubMed].
- Guyomarc'h F., Gueguiner C., Law A.J.R., Horne D.S., Dalgleish D.G., Role of the soluble and micelle-bound heat-induced protein aggregates on network formation in acid skim milk gels, J. Agric. Food Chem. 51 (2003) 7743–7750 [CrossRef] [PubMed].
- Heertje I., Visser J., Smits P., Structure formation in acid milk gels, Food Microstruct. 4 (1985) 267–277.
- Holt C., Inorganic constituents of milk. III. The colloidal calcium phosphate of cow's milk, J. Dairy Res. 49 (1982) 29–38 [CrossRef] [PubMed].
- Holt C., Biophysique des sels et de la micelle de caséine, in: Gaucheron F. (Ed.), Minéraux et produits laitiers, Tec & Doc, Paris, France, 2004, pp. 113–149.
- Holt C., Davies D.T., Law A.J.R., Effects of colloidal calcium phosphate content and free calcium ion concentration in the milk serum on the dissociation of bovine casein micelles, J. Dairy Res. 53 (1986) 557–572 [CrossRef].
- International Dairy Federation, Cheese and processed cheese – Determination of total phosphorus content (Photometric method), Standard 33C (1987) 1–3.
- Laligant A., Famelart M.-H., Brulé G., Piot M., Paquet D., Fermentation by lactic bacteria at two temperatures of pre-heated reconstituted milk. I – Behaviour of proteins and minerals, Lait 83 (2003) 181–192 [CrossRef].
- Le Graët Y., Brulé G., Les équilibres minéraux du lait : influence du pH et de la force ionique, Lait 73 (1993) 51–60 [CrossRef].
- Lee W.J., Lucey J.A., Rheological properties, whey separation, and microstructure in set-style yogurt: effects of heating temperature and incubation temperature, J. Text. Stud. 34 (2004) 515–536 [CrossRef].
- Lin S.H.C., Leong S.L., Dewan R.K., Bloomfield V.A., Morr C.V., Effect of calcium ion on the structure of native bovine casein micelles, Biochemistry 11 (1972) 1818–1821 [CrossRef] [PubMed].
- Lucey J.A., Dick C., Singh H., Munro P.A., Dissociation of colloidal calcium phosphate-depleted casein particles as influenced by pH and concentration of calcium and phosphate, Milchwissenschaft 52 (1997) 603–606.
- Lucey J.A., Tamehana M., Singh H., Munro P.A., Effect of interactions between denatured whey proteins and casein micelles on the formation and rheological properties of acid skim milk gels, J. Dairy Res. 65 (1998) 555–567 [CrossRef].
- Mekmene O., Le Graët Y., Gaucheron F., A model for predicting salt equilibria in milk and mineral-enriched milks, Food Chem. 116 (2009) 233–239 [CrossRef].
- Odagiri S., Nickerson T.A., Complexing of calcium by hexametaphosphate, oxalate, citrate, and ethylenediamine-tetraacetate in milk. II. Dialysis of milk containing complexing agents, J. Dairy Sci. 48 (1965) 19–22 [PubMed].
- Ono T., Dan H.T., Odagiri S., Dissociation of bovine casein micelles by dialysis, Agric. Biol. Chem. 42 (1978) 1063–1064.
- Ono T., Furuyama T., Odagiri S., Dissociation of large and small bovine casein micelles by dialysis, Agric. Biol. Chem. 45 (1981) 511–512.
- Ozcan-Yilsay T., Lee W.J., Horne D., Lucey J.A., Effect of trisodium citrate on rheological and physical properties and microstructure of yogurt, J. Dairy Sci. 90 (2007) 1644–1652 [CrossRef] [PubMed].
- Pitkowski A., Nicolai T., Durand D., Scattering and turbidity study of the dissociation of casein by calcium chelation, Biomacromolecules 9 (2008) 369–375 [CrossRef] [PubMed].
- Premlal Ranjith H.M., Lewis M.J., Maw D., Production of calcium-reduced milks using an ion-exchange resin, J. Dairy Res. 66 (1999) 139–144 [CrossRef] [PubMed].
- Schuck P., Piot M., Méjean S., Fauquant J., Brulé G., Maubois J.-L., Déshydratation des laits enrichis en caséine micellaire par microfiltration; comparaison des propriétés des poudres obtenues avec celles d'une poudre de lait ultra-propre, Lait 74 (1994) 47–63.
- Singh H., Fox P.F., Heat stability of milk:
influence of colloidal and soluble salts and
protein modification on the pH-dependent
dissociation of micellar
 -casein, J. Dairy
Res. 54 (1987) 523–534 [CrossRef].
-casein, J. Dairy
Res. 54 (1987) 523–534 [CrossRef].
- Singh H., Fox P.F., Heat stability of milk:
role of
 -lactoglobulin in the pH-dependent
dissociation of micellar -casein, J. Dairy
Res. 54 (1987) 509–521 [CrossRef].
-lactoglobulin in the pH-dependent
dissociation of micellar -casein, J. Dairy
Res. 54 (1987) 509–521 [CrossRef].
- Udabage P., McKinnon I.R., Augustin M.A., Mineral and casein equilibria in milk: effects of added salts and calcium-chelating agents, J. Dairy Res. 67 (2000) 361–370 [CrossRef] [PubMed].
- Udabage P., McKinnon I.R., Augustin M.A., Effects of mineral salts and calcium chelating agents on the gelation of renneted skim milk, J. Dairy Sci. 84 (2001) 1569–1575 [PubMed].
- Walstra P., Jenness R., Salts, in: Walstra P., Jenness R. (Eds.), Dairy Chemistry and Physics, John Wiley and sons, New York, 1984, pp. 42–57.
- Ward B.R., Goddard S.J., Augustin M.A., McKinnon I.R., EDTA-induced dissociation of casein micelles and its effect on foaming properties of milk, J. Dairy Res. 64 (1997) 495–504 [CrossRef].
All Tables
Physicochemical characteristics of milk samples during dialysis against a weak cation exchanger. D2 and D3 are two repetitions of the dialysis experiment. tdialysis, time of dialysis; WP, whey proteins; tgel, gelation time; pHgel, gelation pH; tanδmin, minimum value of tanδ just after gelation; tanδ800, tanδ at 800 min; Δtan, difference between maximal and minimal value of tanδ; G′800, G′ at 800 min; tanδ800, tanδ at 800 min.
All Figures
|
Figure 1. (a) Total (closed black symbols) and casein-bound (closed grey symbols) calcium. (b) Total (closed black symbols) and inorganic casein-bound (closed grey symbols) phosphate. (c) Soluble calcium (closed symbols) and phosphate (open symbols). (d) Total sodium. (e) Milk pH. (f) OD of unheated milk samples as a function of the dialysis time for three dialysis experiments, D1 (♦), D2 (■) and D3 (●). The three dialysis were performed against a milk permeate containing a weak cation-exchanger. Bars are the standard deviations. |
| In the text | |
|
Figure 2. (a) Soluble casein contents in milk during dialysis D3 obtained by RP-HPLC. Values were calculated as the percent peak area of each casein in supernatant to its area in milk. Dialysed milks were either non-heat-treated (close symbols) or heat-treated (90 °C-24 min) (open symbols): αs1-casein (■, □), αs2-casein (♦, ◊), κ-casein (, ∆) and β-casein (●, ○). The mineral depletions are the reduction in total contents in percent of the content in undialysed milk. (b) Elastic modulus (G′, in black) and loss tangent (tanδ, in grey) during acid gelation of milk samples dialysed (dialysis D2) for 0 h (○), 14.5 h (∆), 22.08 h (□), 38.42 h (◊) and 43.08 h (+). |
| In the text | |
|
Figure 3. Mean particle size in dialysed milk as a function of the dialysis time for three dialysis experiments, D1 (♦), D2 (■) and D3 (●). The particle size values of all samples were not significantly different according to a Student t test (P < 0.03). |
| In the text | |