Free Access
Figure 1.
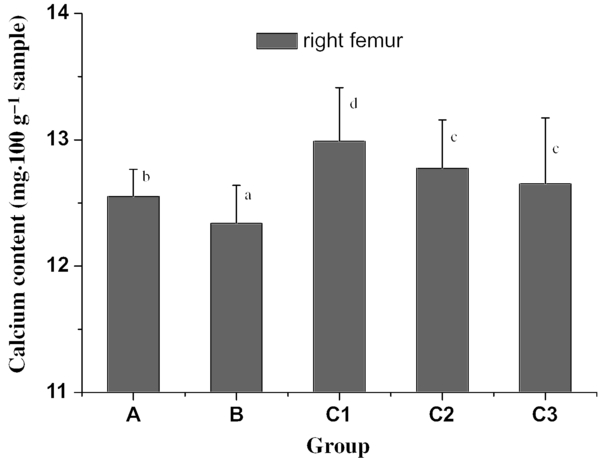
CC of femur (mean ± SD, n = 10). The CC of each right femur was determined using atomic absorption spectrophotometry method. A, sham operation; B, OVX model control; C1, OVX rats diet with BCAP of 0.04 g·d−1; C2, OVX rats diet with BCAP of 0.20 g·d−1; C3, OVX rats diet with BCAP of 0.40 g·d−1. Values followed by different letters are significantly different (P < 0.05).