| Issue |
Dairy Sci. Technol.
Volume 90, Number 5, September–October 2010
|
|
|---|---|---|
| Page(s) | 565 - 577 | |
| DOI | https://doi.org/10.1051/dst/2010019 | |
| Published online | 26 April 2010 | |
Original article
Light-induced protein and lipid oxidation in cheese: Dependence on fat content and packaging conditions
干酪的脂肪含量和包装条件与光致脂肪和蛋白氧化的关系
Oxydation des protéines et des lipides dans les fromages induite par la lumière : incidence de la teneur en matière grasse et des conditions d’emballage
1
Department of Food Science, Faculty of Agricultural Sciences, Aarhus University, P.O. Box 50, DK-8830 Tjele, Denmark
2
Arla Foods amba, Global Ingredients R&D, Sønderupvej 26, DK-6929 Videbæ k, Denmark
3
Arla Foods, Innovation Centre Brabrand, Rørdrumvej 2, DK-8220 Brabrand, Denmark
* Corresponding author (通讯作者): This email address is being protected from spambots. You need JavaScript enabled to view it.
Received:
28 August 2009
Revised:
17 February 2010
Accepted:
18 February 2010
Abstract
Photo-oxidation of cheese products has become an issue due to the fact that packaging of cheeses in transparent materials is very frequently used. The present study aimed to investigate the effect of fat content and availability of oxygen on light-induced oxidation in cheese, as we expected that the fat content would affect the oxidation pathways. Two different model cheeses with 5.4% and 18% fat were packed in air and in vacuum, respectively. The contents of protein (dityrosine and dimethyl disulphide (DMDS)) and lipid (lipid hydroperoxides, pentanal, hexanal and heptanal) oxidation products were significantly reduced in vacuum-packed cheeses compared to cheeses packed in air. Protein oxidation correlated to the concentration of lipids in the cheeses, and interactions between the lipid radicals and proteins seemed to be decisive for the generation of dityrosine, whereas the influence of lipid radicals on the generation of the DMDS seemed more ambiguous. The higher levels of dityrosine and DMDS in the cheese with a high fat content indicated that transfer of radicals from the lipids to the proteins occurred. Even though the generation of DMDS was reduced in vacuum-packed cheese when compared to cheese packed in air, DMDS was formed in vacuum-packed cheese.
摘要
由于商业化包装干酪的大量使用,包装干酪中脂肪光氧化的问题越来越突出。本文探讨了包装干酪中脂肪含量和包装中可利用氧气量对光引起的脂肪氧化作用的影响,以其探讨脂肪含量与光氧化途径之间的关系。将脂肪含量为 5.4% 和 18%的两种干酪分别采用有空气和真空包装。真空包装干酪中的蛋白氧化产物(二酪氨酸、二甲基二硫醚 DMDS) 和脂肪氧化产物(脂质氢过氧化物、戊醛、己醛、庚醛)的含量明显低于有空气包装的干酪。在干酪中蛋白质的氧化作用与脂肪浓度相关,而且脂质基团与蛋白质之间的相互作用程度是由产生的二酪氨酸的量来决定的,但是产生的 DMDS 对脂质基团的影响则难以判定。高脂肪干酪中含有较高水平的二酪氨酸和 DMDS,这个结果表明脂肪到蛋白质分子之间发生了基团的转移。与有空气的包装相比,尽管真空包装干酪中 DMDS 的量显著地减少,但是在真空包装的干酪中还是能够检测出 DMDS。
Résumé
La photo-oxydation des fromages est devenue un sujet d’intérêt en raison de l’utilisation accrue de matériaux transparents pour le conditionnement les fromages. La présente étude avait pour but d’évaluer l’effet de la teneur en matière grasse et de la disponibilité en oxygène sur l’oxydation photo-induite dans les fromages, car il était attendu que la teneur en matière grasse devait affecter les réactions d’oxydation. Deux modèles de fromage différents, contenant respectivement 5,4 % et 18 % de matière grasse, ont été conditionnés en présence d’air ou sous vide. Les teneurs en produits d’oxydation des protéines (dityrosine, diméthyl disulfide (DMDS)) et des lipides (hydroperoxydes, pentanal, hexanal, heptanal) étaient significativement réduites dans les fromages conditionnés sous vide, en comparaison avec ceux conditionnés sous air. L’oxydation des protéines était corrélée à la concentration en lipides des fromages, et les interactions entre les radicaux lipidiques et les protéines semblaient être déterminantes pour la génération de dityrosine, alors que l’influence des radicaux lipidiques sur la génération du DMDS semblait moins évidente. Les niveaux plus élevés de dityrosine et de DMDS dans le fromage contenant une teneur élevée en matière grasse montraient qu’un transfert de radicaux avait lieu des lipides vers les protéines. Même si la génération de DMDS était réduite dans le fromage conditionné sous vide en comparaison au fromage conditionné sous air, le DMDS se formait dans le fromage conditionné sous vide.
Key words: protein oxidation / fat content / light exposure / radical transfer
关键字 : 蛋白氧化 / 脂肪含量 / 曝光量 / 基团转移
Mots clés : oxydation des protéines / teneur en matière grasse / exposition à la lumière / transfert de radicaux
© INRA, EDP Sciences, 2010
1. INTRODUCTION
Photo-oxidation of cheese products has become an issue due to the fact that packaging of dairy products in transparent materials is very frequently used. In general, lipid oxidation has been the main focus due to its high impact on flavour/off-flavour formation in all dairy products. However, the increasing production and sale of low fat dairy products, including low fat cheeses, makes the oxidation of amino acids and proteins of interest due to its higher impact on off-flavour formation in products with limited fat content. Sulphur compounds have been suggested to be of major importance when speaking of protein oxidation in dairy products, and the oxidation of methionine to methional has been proposed to be the major sulphur oxidation product giving rise to off-flavour in skimmed milk [1]. However, more advanced methods have shown that dimethyl disulphide (DMDS) was the major protein oxidation product in milk [19]. DMDS was reported to be mainly responsible for the off-flavour formation in low fat dairy products such as skimmed milk [15], and DMDS has also been detected in low fat cheese [2].
Storage conditions affect the oxidative stability of cheese, and both modified atmosphere [24] and light exposure [2, 23, 24] have an impact on the formation of oxidation products. Illumination with white light gave rise to riboflavin-mediated photo-oxidation [2], while porphyrins and chlorins played a more important role when exposed to red, orange and yellow light [34]. In the violet, blue and green region riboflavin, porphyrins and chlorins may play a role [32]. Riboflavin-mediated photo-oxidation is believed to take place through two different mechanisms. The type I mechanism in which triplet-excited riboflavin reacts directly with the substrate by abstraction of an electron or a hydrogen from the substrate to generate radicals, or the type II mechanism in which triplet-excited riboflavin reacts with atmospheric oxygen forming the reactive singlet oxygen. The photo-sensitiser riboflavin tends to favour the type I mechanism without any influence of singlet oxygen in aqueous solution [4], but the ratio of the two different mechanisms by which riboflavin acts is still unclear in different dairy products.
Even though much effort has been put into measuring the generation of protein oxidation products such as dityrosine [5, 28] and protein carbonyls [5, 17] in model systems, only few studies concern light-induced protein oxidation in dairy products, and in the cheese system only a single study has shown the presence of dityrosines [3]. The complexity of the cheese matrix may be the reason for the little attention given to this subject as problems with off-flavour formation due to protein oxidation have been agreed on for years [7, 19].
In the present study we investigated lipid and protein oxidation in cheese with high and low fat content packaged with different contents of oxygen. The hypothesis was that high fat content would increase the accumulation of lipid oxidation products during light exposure while low fat content might favour the oxidation of proteins. Reducing the availability of oxygen was expected to reduce the overall generation of both lipid and protein oxidation products.
2. MATERIALS AND METHODS
2.1. Materials
Two cheeses available on the market with different fat content, Cheasy 6% (6% fat) and Samsø (26% fat), were used. Both types of cheese were produced from bovine milk by ARLA Foods amba (Hjørring and Taulov Dairies, Denmark). Neutrase was purchased from Novozymes A/S (Kalundborg, Denmark) and Natamycin (Natamax) from Danisco A/S (Grindsted, Denmark). Ascorbic acid (99.7%), α-, δ- and γ-tocopherol (all > 96%), riboflavin (> 98%), ethylenediaminetetraacetic acid (99%), citric acid monohydrate, iron-(III)-chloride hexahydrate (97%), hexanal (98%), 1-hexanol (99.5%) and heptanal (> 92%) were obtained from Sigma Aldrich Chemie GmbH (Steinheim, Germany). Reagents such as H2SO4 (95–97%), HCl (37%), NaCl (99%), trichloroacetic acid (TCA) (99%), BaCl2 (99%), iron-(II)-sulphate (99.5%), NaH2PO4·2H2O (99.5%), Na2HPO4·2H2O, CaCl2·2H2O (99%) and H2O2 (30%), NaOH (> 99%) were obtained from Merck (Darmstadt, Germany). Sodium acetate, pentanal (97%) and 4-methyl-2-pentanone (99%) came from Fluka Chemie GmbH (Buchs, Germany). Acetonitrile, chloroform, hexane, 2-propanol and methanol (all HPLC-grade) and heptane (99%) were from Rathburn Chemicals (Walkerburn, Scotland). The reagent NH4SCN (99%) was from VWR BHD Prolabo (Leuven, Belgium).
2.2. Production of model cheeses
Model cheese systems (hereafter referred to as cheese) were prepared from the semi-hard, rindless, low fat cheese Cheasy 6% (6% fat) and a Samsø cheese (26% fat) ripened for ~ 6 weeks. Model cheeses were used in order to avoid cheese-to-cheese variation. The original cheese (28.6 kg) was cut into pieces (10 × 10 × 4 cm) and mixed with 14.5 kg pasteurised water in a Scanima Mixer SRB-50 (Scanima A/S, Aalborg, Denmark) for 2 min at 272× g through punching holes of 4 mm until a homogeneous cheese paste was obtained. A total of 12.5 mg·kg−1 Chricin C (Chr. Hansen, Hørsholm, Denmark) was added to prevent microbial growth, and the paste was heated to 80 °C for 5 min. The temperature of the cheese paste was reduced to 45 °C before 0.08 AU of the proteolytic enzyme Neutrase was added, and the paste was mixed for ~ 5 min. The cheese paste was transferred to 1 kg sterile DUMA containers (Gerresheimer Vaerloese A/S, Værløse, Denmark) and cooled to 4 °C before being frozen at −20 °C. The final cheese paste produced from the low fat cheese contained 31.1% dry matter (d.m.) [11], 5.4% fat (~ 17.4% of d.m.) [14] and 21.0% protein (~ 67.5% of d.m.) [12], respectively, while the cheese paste produced from a 26% Samsø cheese contained 40.1% dry matter, 18.3% fat (~ 45.6% of d.m.) and 18.0% protein (~ 44.9% of d.m.). In both types of model cheese, the pH was 5.6, while the salt content [13] was 1.0% and 1.3% in high and low fat model cheeses, respectively. The water activity at 25 °C was 0.988 in the cheese with 18% fat content and 0.989 in the cheese with 5.4% fat when measured on an Aqualab model Series 3TE (Decagon Devices Inc., Pullman, USA). After thawing at 4 °C, the cheese pastes were transferred into the lids (d. 9 mm) of sterile Petri dishes (Frisenette, Knebel, Denmark) with a depth of 5 mm, treated with 5 g·L−1 natamycin and packed in vacuum or with air, respectively, in packing material consisting of a layer of 70 μm polyamide and 20 μm polyethylene (PM Pack Service, Horsens, Denmark).
2.3. Experimental design
The cheeses were stored in triplicate at 15 °C under fluorescent light (400–600 nm) from a light source (TL-D 90 de Luxe Pro 18W/965 SLV, Philips, Frankfurt, Germany) as used in retail, with an intensity of 1800 lux measured at the surface of the cheeses. Control samples were stored in parallel. These control samples were wrapped in an aluminium foil to avoid light exposure. The samples were stored for 0, 1, 2, 3, 7, 14 and 21 days and analysed for lipid hydroperoxides, volatile compounds, dityrosine, riboflavin and vitamin E. The cheese samples were homogenised before withdrawn to the different analyses.
2.4. Lipid hydroperoxides
One gram of cheese was dispersed in 5 mL of demineralised water and mixed by Ultraturrax for 45 s. The lipid hydroperoxides were extracted into 10 mL (1:1) methanol:chloroform mixture. The samples were mixed for 30 s on a whirlmixer and finally centrifuged for 10 min at 1000× g. One millilitre of the chloroform phase was transferred into chloroform-cleaned glasses and mixed with 1 mL of iron II/thiocyanate mixture according to the IDF standard (74A:1991) modified by Østdal et al. [25]. Absorbance was measured at 500 nm with 700 nm used as background subtraction on an HP-8453 diode array spectrophotometer from Agilent Technologies (Palo Alto, USA), and quantification was performed according to external standards using a calibration curve made in the concentrations 0.5, 1.0, 2.5, 5.0, 7.5, 10.0 and 20.0 μg·mL−1 of iron (III). The samples were diluted properly to be within the range of the standard curve. Samples were analysed in triplicate.
2.5. Volatile compounds
The volatile compounds (pentanal, hexanal, heptanal and DMDS) were identified and quantified by GC-MS headspace analysis. One millilitre of deionised (18.2 MΩ) filtered water (0.22 μm) plus 1 mL of internal standard (100 ng·mL−1 4-methyl-2-pentanone) was transferred to a 12.5 mL vial containing 2 g of light-treated cheese and sealed with Teflon before incubation at 37 °C for 30 min. The headspace was analysed for volatile compounds using a Carboxen/PDMS SPME fibre with a film thickness of 30 μm from Supelco (Bellefonte, USA), which was incubated at 60 °C for 30 min in the headspace of each sample. Desorption of the sample from the fibre was performed into the inlet of a GC 154ON from Agilent Technologies (Waldbronn, Germany) equipped with a Zebron, ZB-5ht column from Phenomenex (Torrance, USA) coated with a non-metal 5%-phenyl 95%-dimethylpolysiloxane phase with the dimensions: 0.25 mm i.d., 0.25 μm and 30 m. Helium was used as carrier gas with a constant flow rate of 1.2 mL·m−1 in 100 N m−2. The splitless injector was kept at 250 °C. An SPME injection sleeve liner from Supleco (Bellefonte, USA) with an inner diameter of 0.75 mm was applied. The column temperature was programmed to stay at 40 °C for 4 min followed by an increase from 40 to 120 °C with a rate of 5 °C·min−1, a hold time of 5 min and a subsequent temperature gradient from 120 to 300 °C with a rate of 20 °C·min−1. Mass spectral analysis was performed in selected ion monitoring according to the ions determined by the use of a standard for each compound (Tab. I) on a quadrupole MSD 5975 (Agilent Technologies, Germany) with a quadrupole temperature of 150 °C and a fragmentation voltage of 70 eV. The ion source temperature was 230 °C, and the interface temperature was 280 °C. Quantification was performed relatively using external standard curves with concentrations of 1–500 ng·mL−1 H2O of each compound to avoid day-to-day variation on individual compounds. Samples were measured in duplicate.
Target and qualifier ions used in the GC-MS measurements.
2.6. Dityrosine
Dityrosine was measured in 1 g of cheese. The cheese was dispersed in 5 mL of demineralised (18.2 MΩ), filtered water (0.22 μm) and mixed on a whirlmixer for 45 s. Before the cheeses were frozen to −20 °C for later analysis, 1 mL of 1 mol·L−1 NaCl in 0.1 mol·L−1 H2SO4 was added to the samples. Twelve millilitre of 2-propanol were added to the thawed samples, and they were subsequently mixed for 3 min before fat extraction was performed after addition of 9 mL of pentane. After another 3 min of mixing, the samples were centrifuged for 5 min at 1000× g. The fat extraction was performed three times before the samples were dissolved in 4 mL of 50 mmol·L−1 phosphate buffer and precipitated in 10% TCA and finally centrifuged for 10 min at 1000× g. The pellet was acid hydrolysed in 6 mol·L−1 HCl overnight and measurements were performed according to Dalsgaard et al. [5] using reverse phase HPLC combined with fluorescence detection. External standard curve (0–2000 nmol·mL−1) of dityrosine was used for quantification and the samples were measured in triplicate.
2.7. Riboflavin
The cheese (1 g) was dispersed in 5 mL of demineralised (18.2 MΩ), filtered water (0.22 μm) and mixed for 30 s on a whirlmixer. Protein was precipitated in 10% TCA on ice for 10 min and subsequently centrifuged at 1000× g for 10 min. Approximately 1 mL of the supernatant was filtered through a cellulose filter (0.45 μm) and transferred directly into brown-coloured vials to avoid further light exposure. The samples were injected onto a reverse phase column (Sorbax SB-C8 with the dimension 4.6 × 150 mm, 5 μm from Agilent Technologies, USA). The riboflavin was quantified using fluorescence detection according to Silva et al. [29]. Quantification was performed using external riboflavin standards: 2.0, 1.5, 0.75, 0.5, 0.1, 0.05, 0.025, 0.01 and 0.005 μg·mL−1 prepared from a 100 μg·mL−1 riboflavin stock solution in 0.02 mol·L−1 NaOH. Samples were measured in triplicate.
2.8. α-Tocopherol
The cheese (1 g) was dissolved in 1 mL of demineralised water mixed for 30 s and subsequently mixed for 10 min with 2 mL of ethanolic ascorbic acid (1%). A saturated potassium hydroxide solution (0.3 mL) was added and mixed for 10 s before incubation for 30 min at 70 °C. While incubated, the samples were shaken every 5 min. Subsequently, the samples were cooled on ice, and 1 mL of demineralised water and 3 mL of heptane were added and mixed for 1 min. The samples were centrifuged at 3 min at 1700× g, and the upper phase was transferred into brown-coloured vials and injected onto a Hypersil Silica column (4.6 × 200 mm, 5 μm from Thermo Fischer Scientific Inc., Waltham, USA), and eluted from the column using mobile phases of 98% hexane and 2% 2-propanol. Fluorescence detection was performed using excitation and emission wavelengths of 295 and 330 nm, respectively. Quantification was performed using an external standard curve. Samples were measured in duplicate.
2.9. Statistical analysis
Statistical analysis was performed using the Generalised Linear Models (GLM) procedure of SAS version 9.2 (SAS Institute Inc., Cary, USA). In order to obtain normality the data were transformed by the log(10) function. The LS-means were calculated and differences regarded as significant at minimum 95%-level (P < 0.05). Differences were classified by the Ryan-Einot-Gabriel-Welsch (REGW) multiple range test (SAS Institute Inc., Cary, USA).
3. RESULTS
The amino acid and protein oxidation products dityrosine and DMDS were used as markers for protein oxidation, while lipid hydroperoxides, pentanal, hexanal and heptanal, were followed as markers for lipid oxidation. Riboflavin and vitamin E (α-tocopherol) were furthermore analysed in order to describe the loss of photo-sensitizer and a naturally occurring antioxidant.
The concentration of riboflavin was 1.3 ± 0.3 μg·g−1 in low fat cheese and 1.5 ± 0.4 μg·g−1 in the cheese with 18% fat at day zero before any photo-oxidation had occurred (Fig. 1A). The level of riboflavin was significantly reduced (P < 0.0001) in both types of cheese already within the first day of exposure to fluorescent light and completely vanished within the first 2–3 days of light exposure, independent of the presence of oxygen. No significant difference (α = 0.05) in the levels or in the degradation of riboflavin was measured between the cheeses. The generation of dityrosine mirrored the loss of riboflavin in cheeses packed in air, and this was reflected in a regression coefficient of −0.83 and −0.91 for cheeses packed in air with 5.4% and 18% fat, respectively. A plateau was reached within the first three days of light exposure with two different levels for each of the two types of cheeses. Thus, the dityrosine content was 4.51 and 12.36 nmol·g−1 cheese in cheeses with 5.4% and 18% fat, respectively, at the 21st day of incubation when the cheeses were packed in air. The plateau levels reached at the third day of light exposure were significantly different (P < 0.001) between the low fat cheese and the cheese with 18% fat when they were packed in air (Fig. 1B), while insignificant changes (α = 0.05) were seen in the level of dityrosine in the vacuum-packed cheeses.
 |
Figure 1. Decrease of the naturally occurring photo-sensitiser riboflavin in low fat model cheese packed in atmospheric air (○) and in vacuum (●) and in model cheese with 18% fat also packed in atmospheric air (Δ) and in vacuum (▼) after illumination with fluorescent light for a period of 21 days (A) and accumulation of dityrosine (B), lipid hydroperoxides (C) and DMDS (D). Rel. Int.: calculated relatively to external standard curves (ng·mL−1). Bars indicate standard deviations of triplicate for riboflavin, dityrosine and lipid hydroperoxides and duplicate for DMDS. Small squares illustrate low fat cheese in atmospheric air (○) and in vacuum (●) for the first seven days of light exposure. |
The level of lipid hydroperoxides in the cheeses packed in air increased steadily for the whole period of incubation (21 days) up to 1.2 and 5.1 μg·g−1 cheese in cheeses with 5.4% and 18% fat, respectively, whereas the lipid hydroperoxide accumulation was insignificant (α = 0.05) for the first 14 days of incubation in the vacuum-packed low fat cheeses (Fig. 1C). Within the last 14 days of incubation (days 7–21), the level of lipid hydroperoxides in the vacuum-packed cheese with 18% fat indicated an increasing tendency, even though the increase found was insignificant (α = 0.05). The level of lipid hydroperoxides in the vacuum-packed cheese with 18% fat was significantly (P < 0.001) lower (0.9 µg·g−1 cheese) than in the cheeses packed in air (5.1 µg·g−1) after 21 days. The accumulation of DMDS followed to a certain extent a similar pattern as the accumulation of lipid hydroperoxides in the cheese with 18% fat (Fig. 1D), even though the accumulation of DMDS in the cheese with 18% fat tended to be somewhat reduced over time when compared to the lipid hydroperoxide accumulation. In the low fat cheese the accumulation of DMDS was less significant, and a significant difference (P < 0.001) was detected in the levels of generated DMDS between the two types of cheese as well as between the packaging conditions. For the last seven days of incubation (days 14–21), the accumulation of DMDS in the vacuum-packed 18% fat cheeses showed a significant increase (P < 0.001) when compared to the vacuum-packed low fat cheese. The level in the vacuum-packed cheese with 18% fat was comparable to the level of DMDS observed in the low fat cheeses packed in air. Hence, both of the protein oxidation products (dityrosine and DMDS) seemed to be dependent on both fat content and content of oxygen in the packaging, even though the generation of DMDS was less dependent on the availability of air.
The increase in both lipid hydroperoxides continued long after the riboflavin had completely vanished indicating a continuous chain reaction. Chain-breaking antioxidants could avoid this mechanism, but consumption of chain-breaking antioxidants may have occurred upon illumination with light. Vitamin E was therefore measured in the two types of cheese. The only tocopherol present in the two types of cheese was α-tocopherol. The concentrations of α-tocopherol were 1.1 and 3.9 μg·g−1 cheese (data not shown) in cheese with 5.4% and 18% fat, respectively, which reflects the fat content in the two different types of cheese. Within the first seven days, the α-tocopherol content decreased rapidly in the low fat cheese packed in air, after which a stable level was reached (Fig. 2A). The cheese with 18% fat packed in air showed a rapid decrease in α-tocopherol content as well for the first seven days of incubation, even though the relative decrease was not as rapid as for the low fat cheese packed in air. The loss of α-tocopherol continued for the whole period of incubation in the cheese with 18% fat, even though the decrease was relatively small after the third day of oxidation. The level of α-tocopherol in the cheese with 18% fat (0.8 ± 0.1 μg·g−1 cheese at day 21) never reached the level measured in the low fat cheese (0.3 ± 0.1 μg·g−1 cheese at day 21). In the vacuum-packed cheeses, the content of α-tocopherol decreased more slowly within the first seven days of incubation when compared with the cheese packed in air, and the relative decrease in α-tocopherol was independent of cheese type.
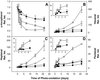 |
Figure 2. Decrease of α-tocopherol (A) in low fat model cheese packed in atmospheric air (○) and in vacuum (●) and in model cheese with 18% fat also packed in atmospheric air (Δ) and in vacuum (▼) after illumination with fluorescent light for a period of 21 days and accumulation of hexanal (B), heptanal (C) and pentanal (D). Rel. Int.: calculated relatively to external standard curves (ng·mL−1) for hexanal, heptanal and pentanal. Rel. Int. for α-tocopherol: calculated relatively to the content of α-tocopherol at the beginning of the experiment. Bars indicate standard deviations of duplicates for all measurements. Small squares illustrate low fat cheese in atmospheric air (○) and in vacuum (●) for the first seven days of light exposure. |
The accumulation of the secondary lipid oxidation products hexanal and heptanal was dependent on time of light exposure, packaging condition and fat content (Figs. 2B and 2C). These two lipid oxidation products showed a lag phase for the first seven days of light exposure in the samples packed in air in both cheeses. After the seventh day of light exposure, the accumulation of hexanal and heptanal increased significantly (P < 0.0001). The accumulation of another secondary lipid oxidation pentanal was dependent on time of light exposure, package condition as well as fat content (Fig. 2D), but did not follow the same pattern as the other two secondary lipid oxidation products, and no lag phase was observed for pentanal in the cheese with 18% fat.
4. DISCUSSION
The accumulation of lipid hydroperoxides indicates that there was no measurable lag phase, and that the generation of lipid hydroperoxides was initially formed from a direct reaction of singlet oxygen with the unsaturated lipids as stated by Havemose et al. [10]. As no lipid hydroperoxides were accumulated in the dark control samples, direct autoxidation seemed to be of no importance in the samples which agrees with the fact that singlet oxygen reacts ~ 1450 times faster with unsaturated fatty acids compared to the reaction between triplet oxygen and unsaturated fatty acids [9, 26]. The accumulation of lipid hydroperoxides continued even after the riboflavin had degraded, and it is proposed that the oxidation process is a chain reaction or an alternative reason could be that other sensitisers e.g. chlorophylls [35] with longer lifetime [32] were involved in the generation of lipid hydroperoxides. Lipid hydroperoxide generation did not show any dependence on the observed plateau in the generation of dityrosine or the complete loss of riboflavin. Therefore, the generation of tyrosyl radicals seems to be of no importance in the generation of lipid hydroperoxides, which has been seen elsewhere [27]. Hence, a singlet dependence mechanism (type II) [9, 26] and a continuous chain reaction might be suggested to give rise to the generation of lipid hydroperoxides.
The formation of DMDS showed an accumulation similar to that of the lipid hydroperoxides in cheese with 18% fat, and it appeared to continue throughout the whole period of light exposure, indicating that a secondary event is responsible for the generation of these two oxidation products later in the light exposure period. Higher levels of lipid hydroperoxides were expected in the cheese with 18% fat compared to the levels in the low fat cheese, but the higher levels of the protein oxidation product DMDS, which were observed in the cheese with 18% fat, were rather unexpected. The higher level of DMDS may reflect that a singlet oxygen-mediated reaction is preferred in a system with a higher fat content due to the higher solubility of oxygen in the lipid phase [4] or higher content of lipid-soluble photo-sensitisers in the cheese with the highest fat content. The generation of DMDS in the cheese with 18% fat seemed to be somewhat reduced over time. Such a reduction in the generation was not observed in the low fat cheese stored in air. A higher consumption of oxygen in the high fat cheese due to a much higher formation of lipid hydroperoxides may result in a lower rate of generation of DMDS later in the study, but a mixed reaction mechanism involving both type I and type II mechanisms may be an alternative explanation for the lower rate. The content of oxygen was of less importance for the generation of DMDS than for the accumulation of the other measured oxidation products. Therefore we suggest that the generation of DMDS is not solely due to singlet oxidation as reported elsewhere [15, 30], but is also caused by a reaction with other reactive species. However, independently of the mechanism involved in the accumulation of the different oxidation products shown in the present study, it is clearly demonstrated by accumulation of DMDS in vacuum-packed cheeses that reducing the content of oxygen may not prevent the off-flavour formation caused by protein oxidation.
The level of hexanal and heptanal indicated a lag phase within the first 3–7 days of light exposure, after which the accumulation increased rapidly. The lag phase corresponds very well to the period of time, where the content of α-tocopherol, which was used as marker for naturally occurring antioxidants, had reached a more or less constant level in the photo-oxidised cheeses. These findings indicate that consumption of naturally occurring antioxidants has a large effect on the generation of secondary lipid oxidation products. However, accumulation of lipid hydroperoxides did not show any dependence on the relatively quick consumption of α-tocopherol within the first 3–7 days of light exposure, indicating that singlet quenching by α-tocopherol, and maybe also other naturally occurring antioxidants, was marginal. This is in contrast to the finding by Fragata and Bellemare [8] and Yang et al. [37] who showed α-tocopherol to be an efficient singlet oxygen quencher. On the other hand, it is well known that α-tocopherol is a chain-breaking antioxidant [16]. This agrees with the results obtained in the present study where the accumulation of secondary lipid oxidation was shown dependent on the presence of α-tocopherol. The loss of α-tocopherol observed in the present study upon illumination is in agreement with the findings of Havemose et al. [10] who also observed a decrease of α-tocopherol in milk upon exposure to light.
The accumulation of the third secondary oxidation product pentanal did not show any lag phase, and so this lipid oxidation product did not seem to have the same dependence on the loss of naturally occurring antioxidants as the other three secondary lipid oxidation products. Pentanal showed an accumulation pattern similar to the one observed for lipid hydroperoxides, indicating that the pathway by which pentanal is produced may be different from the one observed for hexanal and heptanal as suggested elsewhere [22]. A direct interaction with triplet-excited riboflavin through a type I mechanism as suggested by Lee [21] may explain the difference observed for the accumulation of pentanal when compared to the accumulation of hexanal and heptanal instead of a singlet-mediated reaction which is partly responsible for the generation of hexanal [22, 36].
The generation of dityrosine mirrored the loss of riboflavin for cheeses packed in air, and a plateau was reached within the first three days of illumination with fluorescent light. Similar results have been seen previously in aqueous model systems [5], indicating that the regeneration of riboflavin as suggested by Skibsted [30] is not an ongoing process, or that the bleaching of riboflavin is much faster than the rate of regeneration, hence suggesting incapability to preserve the concentration of riboflavin. Riboflavin has previously been shown to be able to generate 103–105 molecules of singlet oxygen before becoming inactive [20]. The direct dependence on riboflavin indicated an interaction between triplet riboflavin and tyrosine, which is consistent with dityrosine being formed through a type I mechanism [28]. However, the dityrosine formation was approximately threefold higher in the cheeses with 18% fat compared to low fat cheese, and this relation is supposed to reflect the difference in fat content as the amount of protein was similar in the two cheese types. The generation of dityrosine therefore seemed to be dependent on the fat content. Dityrosine has been suggested to be formed through radical reaction with lipid hydroperoxides [18, 27], and therefore one suggestion could be that interaction between lipid free radicals and tyrosine residues is responsible for the higher content of dityrosine found in the cheese with the high fat content. This supports the idea of milk proteins acting as antioxidants as reported elsewhere [6, 31], and the mechanism behind it may be scavenging of free lipid radicals. Alternatively the higher content of dityrosine in the cheese with high fat content could reflect more fat-soluble photo-sensitisers as found by Wold et al. [32]. The fat-soluble photo-sensitisers detected in various dairy products [33, 35], e.g. chlorophyll a and protoporphyrin, have been identified to contribute to the singlet oxygen-mediated type II mechanism and only 20% of the chlorophyll a activity could be attributed to other mechanisms (type I or direct autoxidation) [26]. The same study showed that protoporphyrin only had type II activity [26]. Dityrosine is known to be generated by the type I mechanism [28]; therefore, the scavenging effect of tyrosine on free lipid radicals seemed to be the most likely reason for the higher content of dityrosine in the cheese with 18% fat when compared to the low fat cheese. The plateau observed in the generation of dityrosine after the third day of light exposure was, however, not seen for the lipid hydroperoxides; but when the proteins have formed cross-linkages to a certain extent, it is hypothesised that they got locked in a certain position, even though there may have been generated more tyrosyl radicals in the proteins later on in the experiment. These radicals cannot get in contact and form cross-links with each other.
5. CONCLUSION
The study illustrated that lipid and protein oxidation in complex matrices such as cheese is a rather complicated process. Protein oxidation correlated to the concentration of lipids in the cheeses, and interaction between the lipid radicals and proteins seemed to be decisive for the generation of dityrosine, whereas the influence of lipid radicals on the generation of the other protein oxidation product called DMDS seemed more ambiguous. The content of α-tocopherol did not affect any of the measured protein oxidation products (dityrosine and DMDS), but had an effect on the secondary lipid oxidation products (hexanal and heptanal). The contents of protein (dityrosine and DMDS) and lipid (lipid hydroperoxides, pentanal, hexanal and heptanal) oxidation products were significantly reduced in vacuum-packed cheeses compared to cheeses packed in air. Even though the generation of DMDS was reduced in vacuum-packed cheese when compared to cheeses packed in air, this study demonstrates that these protein oxidation products are formed in vacuum-packed cheese.
Acknowledgments
Heidi Taulborg Jørgensen is thanked for her skilful assistance in the pilot plant producing the model cheeses. The Danish Dairy Research Foundation and the Innovation Law under the auspices of the Ministry of Food, Agriculture and Fisheries, Denmark are thanked for financing the study.
References
- Allen C., Parks O.W., Evidence for methional in skim milk exposed to sunlight, J. Dairy Sci. 58 (1975) 1609–1611. [CrossRef] [Google Scholar]
- Andersen L.T., Lund M.N., Glyager R., Jensen S.B., Mortensen G., Skibsted L.H., Light-induced deterioration of reduced-fat cream cheese. Relative importance of protein and lipid oxidation, Milchwissenschaft 61 (2006) 162–165. [Google Scholar]
- Balestrieri M., Spagnuolo M.S., Cigliano L., Storti G., Ferrara L., Abrescia P., Fedele E., Evaluation of oxidative damage in mozzarella cheese produced from bovine or water buffalo milk, Food Chem. 77 (2002) 293–299. [CrossRef] [Google Scholar]
- Bradley D.G., Min D.B., Singlet oxygen oxidation of foods, Crit Rev. Food Sci. Nutr. 31 (1992) 211–236. [CrossRef] [PubMed] [Google Scholar]
- Dalsgaard T.K., Otzen D., Nielsen J.H., Larsen L.B., Changes in structures of milk proteins upon photo-oxidation, J. Agric. Food Chem. 55 (2007) 10968–10976. [CrossRef] [PubMed] [Google Scholar]
- Diaz M., Dunn C.M., McClements D.J., Decker E.A., Use of caseinophosphopeptides as natural antioxidants in oil-in-water emulsions, J. Agric. Food Chem. 51 (2003) 2365–2370. [CrossRef] [PubMed] [Google Scholar]
- Dimick P.S., Kilara A., Photo-oxidative changes in milk-proteins and amino-acids, Milchwissenchaft 35 (1983) 289–299. [Google Scholar]
- Fragata M., Bellemare F., Model of singlet oxygen scavenging by alpha-tocopherol in biomembranes, Chem. Phys. Lipids 27 (1980) 93–99. [CrossRef] [Google Scholar]
- Frankel E.N., Chemistry of free radical and singlet oxidation of lipids, Prog. Lipid Res. 23 (1984) 197–221. [CrossRef] [PubMed] [Google Scholar]
- Havemose M.S., Weisbjerg M.R., Bredie W.L.P., Nielsen J.H., The influence of feeding different types of roughage on the oxidative stability of milk, Int. Dairy J. 14 (2004) 563–570. [CrossRef] [Google Scholar]
- IDF, Standard 4A, Cheese and processed cheeese, determination of the total solids content (reference method), Int. Dairy Fed., Brussels, Belgium, 1982. [Google Scholar]
- IDF, Standard 20A, Milk, determination of nitrogen content (Kjeldahl method) and calculation of crude protein content, Int. Dairy Fed., Brussels, Belgium, 1986. [Google Scholar]
- IDF, Standard 88A, Cheese and processed cheese products determination of chloride content potentiometric titration method, Int. Dairy Fed., Brussels, Belgium, 1988. [Google Scholar]
- IDF, Standard 152A, Milk and milk products, determination of fat content, general guidance on the use of butyrometric methods, Int. Dairy Fed., Brussels, Belgium, 1997. [Google Scholar]
- Jung M.Y., Yoon S.H., Lee H.O., Min D.B., Singlet oxygen and ascorbic acid effects on dimethyl disulfide and off-flavor in skim milk exposed to light, J. Food Sci. 63 (1998) 408–412. [CrossRef] [Google Scholar]
- Kaiser S., Di Mascio P., Murphy M.E., Sies H., Physical and chemical scavenging of singlet molecular-oxygen by tocopherols, Arch. Biochem. Biophys. 277 (1990) 101–108. [CrossRef] [PubMed] [Google Scholar]
- Kanner J.D., Fennema O., Photooxidation of tryptophan in the presence of riboflavin, J. Agric. Food Chem. 35 (1987) 71–76. [CrossRef] [Google Scholar]
- Kikugawa K., Kato T., Hayasaka A., Formation of dityrosine and other fluorescent amino-acids by reaction of amino-acids with lipid hydroperoxides, Lipids 26 (1991) 922–929. [CrossRef] [PubMed] [Google Scholar]
- Kim Y.D., Morr C.V., Dynamic headspace analysis of light activated flavor in milk, Int. Dairy J. 6 (1996) 185–193. [CrossRef] [Google Scholar]
- Kochevar I.E., Edmond R.W., Photosensitized production of singlet oxygen, in: Packer L. (Ed.), Singlet Oxygen, UV-A and Ozone, Methods in Enzymology, Academic Press, London, UK, 2000, pp. 20–28. [CrossRef] [Google Scholar]
- Lee H.H., Photooxidation and photosensitized oxidation of linoleic acid, milk and lard, Ph.D. Thesis, Tje Ohio State University, Columbus, USA, 2002. [Google Scholar]
- Lee J.H., Min D.B., Changes of headspace volatiles in milk with riboflavin photosensitization, J. Food Sci. 74 (2009) C563–C568. [CrossRef] [PubMed] [Google Scholar]
- Mortensen G., Sørensen J., Stapefeldt H., Effect of light and oxygen transmission characteristics of packaging materials on photo-oxidative quality changes in semi-hard Havarti cheeses, Packaging Tech. Sci. 15 (2002) 121–127. [CrossRef] [Google Scholar]
- Mortensen G., Sørensen J., Stapelfeldt H., Effect of modified atmosphere packaging and storage conditions on photooxidation of sliced Havarti cheese, Eur. Food Res. Tech. 216 (2003) 57–62. [Google Scholar]
- Østdal H., Andersen H.J., Nielsen J.H., Antioxidative activity of urate in bovine milk, J. Agric. Food Chem. 48 (2000) 5588–5592. [CrossRef] [PubMed] [Google Scholar]
- Rawls H.R., van Santen P.J., A possible role for singlet oxygen in the initiation of fatty acid autoxidation, J. Am. Oil Chem. Soc. 47 (1970) 121–125. [CrossRef] [Google Scholar]
- Saeed S., Gillies D., Wagner G., Howell N.K., ESR and NMR spectroscopy studies on protein oxidation and formation of dityrosine in emulsions containing oxidised methyl linoleate, Food Chem. Toxicol. 44 (2006) 1385–1392. [CrossRef] [PubMed] [Google Scholar]
- Silva E., GodoyJ., Riboflavin sensitized photooxidation of tyrosine, Int. J. Vitam. Nutr. Res. 64 (1994) 253–256. [PubMed] [Google Scholar]
- Silva L.S., Trevisan M.G., Rath S., Poppi R.J., Reyes F.G.R., Chromatographic determination of ribofflavin in the presence of tetracyclines in skimmed and full cream milk using fluorescence detection, J. Brazilian Chem. Soc. 16 (2005) 1174–1178. [Google Scholar]
- Skibsted L.H., Light-induced changes in dairy product, Bull. IDF 346 (2000) 4–9. [Google Scholar]
- Taylor M.J., Richardson T., Antioxidant activity of skim milk – effect of heat and resultant sulfhydryl-groups, J. Dairy Sci. 63 (1980) 1783–1795. [CrossRef] [Google Scholar]
- Wold J.P., Bro R., Veberg A., Lundby F., Nilsen A.N., Moan J., Active photosensitizers in butter detected by fluorescence spectroscopy and multivariate curve resolution, J. Agric. Food Chem. 54 (2006) 10197–10204. [CrossRef] [PubMed] [Google Scholar]
- Wold J.P., Dahl A.V., Lundby F., Nilsen A.N., Juzeniene A., Moan J., Effect of oxygen concentration on photo-oxidation and photosensitizer bleaching in butter, J. Photochem. Photobiol. 85 (2009) 669–676. [CrossRef] [Google Scholar]
- Wold J.P., Veberg A., Lundby F., Nilsen A.N., Moan J., Influence of storage time and color of light on photooxidation in cheese: a study based on sensory analysis and fluorescence spectroscopy, Int. Dairy J. 16 (2006) 1218–1226. [CrossRef] [Google Scholar]
- Wold J.P., Veberg A., Nilsen A., Iani V., Juzenas P., Moan J., The role of naturally occurring chlorophyll and porphyrins in light-induced oxidation of dairy products. A study based on fluorescence spectroscopy and sensory analysis, Int. Dairy J. 15 (2005) 343–353. [CrossRef] [Google Scholar]
- Yang S., Lee J., Lee J., Lee J., Effects of riboflavin-photo sensitization on the formation of volatiles in linoleic acid model systems with sodium azide or D2O, Food Chem. 105 (2007) 1375–1381. [CrossRef] [Google Scholar]
- Yang W.T., Lee J.H., Min D.B., Quenching mechanisms and kinetics of alpha-tocopherol and beta-carotene on the photosensitizing effect of synthetic food colorant FD&C Red No. 3, J. Food Sci. 67 (2002) 507–510. [CrossRef] [Google Scholar]
All Tables
All Figures
|
Figure 1. Decrease of the naturally occurring photo-sensitiser riboflavin in low fat model cheese packed in atmospheric air (○) and in vacuum (●) and in model cheese with 18% fat also packed in atmospheric air (Δ) and in vacuum (▼) after illumination with fluorescent light for a period of 21 days (A) and accumulation of dityrosine (B), lipid hydroperoxides (C) and DMDS (D). Rel. Int.: calculated relatively to external standard curves (ng·mL−1). Bars indicate standard deviations of triplicate for riboflavin, dityrosine and lipid hydroperoxides and duplicate for DMDS. Small squares illustrate low fat cheese in atmospheric air (○) and in vacuum (●) for the first seven days of light exposure. |
| In the text | |
|
Figure 2. Decrease of α-tocopherol (A) in low fat model cheese packed in atmospheric air (○) and in vacuum (●) and in model cheese with 18% fat also packed in atmospheric air (Δ) and in vacuum (▼) after illumination with fluorescent light for a period of 21 days and accumulation of hexanal (B), heptanal (C) and pentanal (D). Rel. Int.: calculated relatively to external standard curves (ng·mL−1) for hexanal, heptanal and pentanal. Rel. Int. for α-tocopherol: calculated relatively to the content of α-tocopherol at the beginning of the experiment. Bars indicate standard deviations of duplicates for all measurements. Small squares illustrate low fat cheese in atmospheric air (○) and in vacuum (●) for the first seven days of light exposure. |
| In the text | |