Free Access
Figure 6.

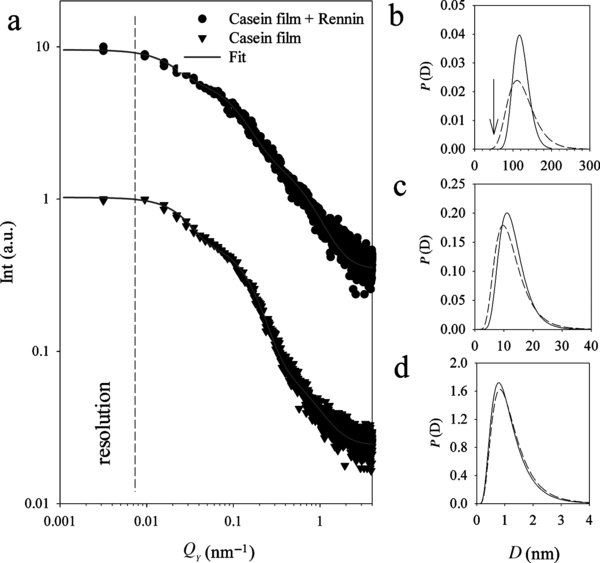
(a) Comparison of the scattering functions, measured within the area of the rennin droplet (dots) and outside in the casein film (triangles): fits to the scattering functions are indicated by solid lines. Calculated size distributions from fits corresponding to the casein film only (solid lines) and to the rennin droplet (dashed lines) are shown for casein micelles (mean size 120 nm) in (b), for the casein micelle substructure (mean size: 12 nm) in (c) and for CCP particles (mean size: 1 nm) in (d).


