Free Access
Figure 6.
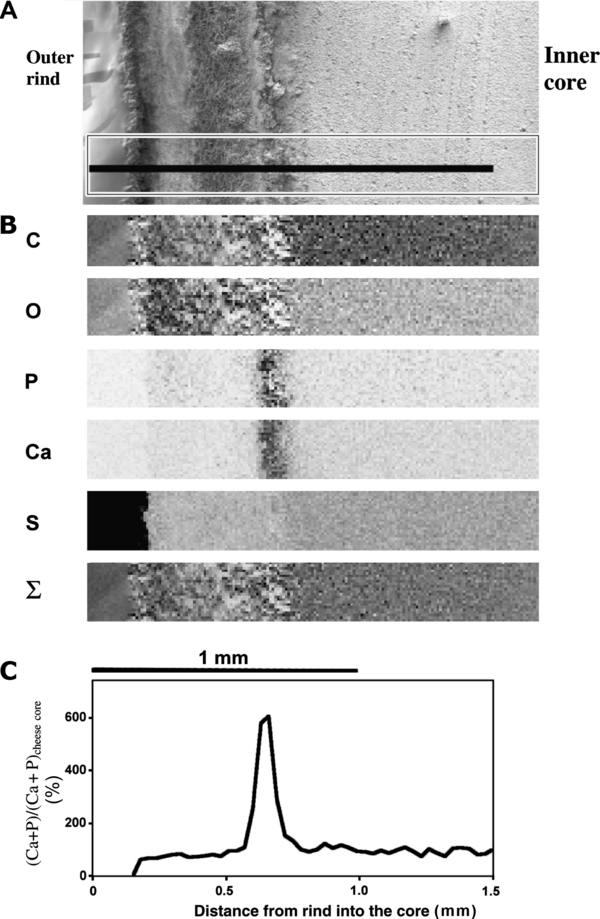
X-ray analysis of UF-cheese at day 50. (A) High-resolution image of secondary electrons showing the cartography zone of analysis. (B) Cartography of carbon (C), oxygen (O), phosphorus (P), calcium (Ca), sulphur (S) and of total X photons (Σ). (C) Changes in (Ca + P) along the black line drawn in (A) as a percentage of (Ca + P) in the core zone.