Free Access
Figure 4.
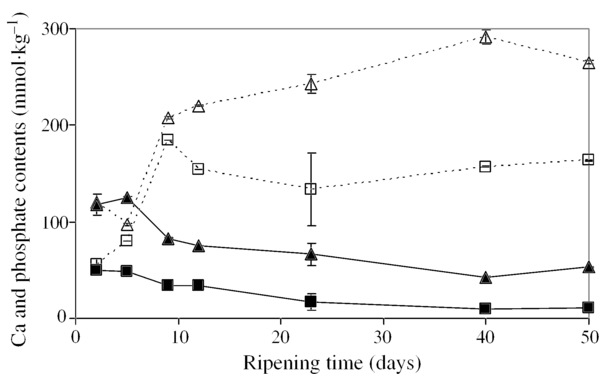
Concentrations of calcium (▲, ∆) and phosphorus (■, □) during the ripening of UF-cheese in the surface (open symbol and dotted lines) and the core fraction (close and continuous lines) of UF-cheese. Mean values and SDs are presented.