Free Access
Figure 3.
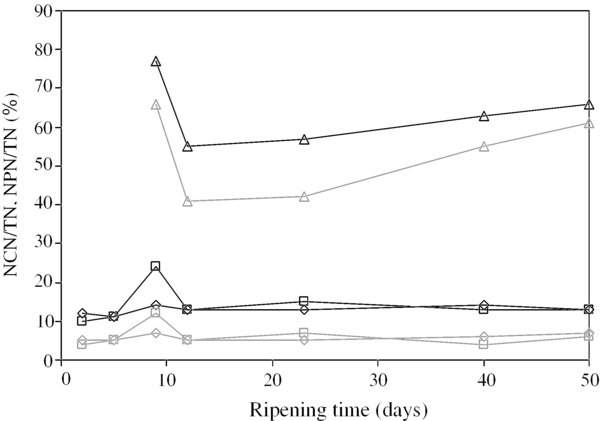
Levels of proteolysis expressed as the ratio of non-casein nitrogen to total nitrogen (NCN/TN in %, black symbols) and the ratio of non-protein nitrogen to total nitrogen (NPN/TN in %, grey symbols) in the rind (∆, ∆), in the surface (□, □) and in the core (◊, ◊) of UF-cheese.