Free Access
Figure 2.
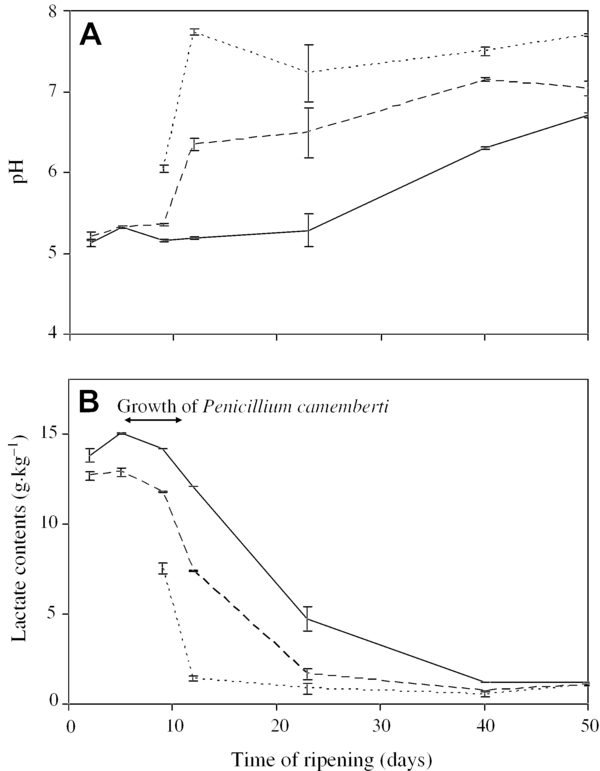
(A) pH and (B) lactate concentration of the rind (......), surface (- - - - - -) and core (——) fractions of UF-cheese throughout ripening. Mean values and SDs of pH values are presented. A larger number of samples (nine samples) were included in the data set at day 23, which resulted in a larger SD.