Figure 6.
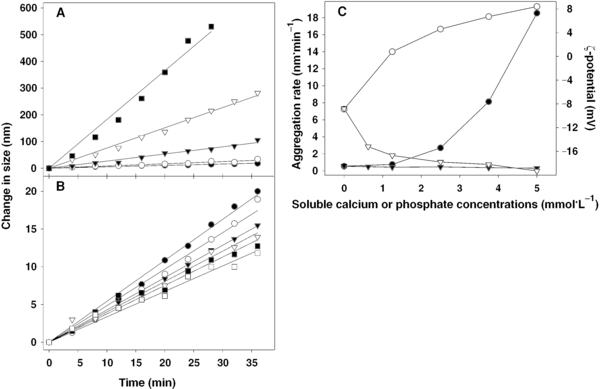
Effect of soluble calcium and soluble phosphate on the changes in average size with time for the 0.5 μm MDCP suspensions at 25 °C, as determined using PCS. (A) MDCP dispersed in solutions of different soluble calcium levels. The soluble calcium levels were: ●, 0 mmol·L−1; ○, 1.25 mmol·L−1; ▼, 2.5 mmol·L−1; ▽, 3.75 mmol·L−1; ■, 5 mmol·L−1. (B) MDCP dispersed in solutions of different soluble phosphate levels. The soluble phosphate levels were: ●, 0 mmol·L−1; ○, 0.625 mmol·L−1; ▼, 1.25 mmol·L−1; ▽, 2.5 mmol·L−1; ■, 3.75 mmol·L−1; □, 5 mmol·L−1. (C) Effect of soluble calcium and soluble phosphate on the rate of aggregation and ζ-potential of MDCP suspensions. ●, rate of aggregation in soluble calcium solutions; ○, ζ-potential in soluble calcium solutions; ▼, rate of aggregation in soluble phosphate solutions; ▽, ζ-potential in soluble phosphate solutions.