Free Access
Figure 3.

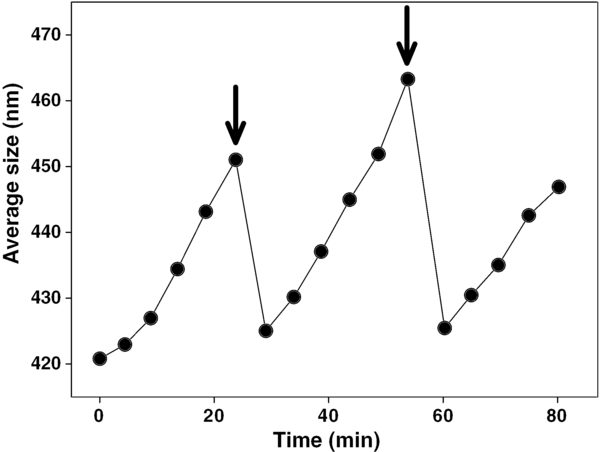
Changes in average size with time for the 0.5 μm MDCP suspensions in water, as determined using PCS. The arrows indicate the point at which the sample was mixed.

Changes in average size with time for the 0.5 μm MDCP suspensions in water, as determined using PCS. The arrows indicate the point at which the sample was mixed.